
Before we get started, I'd really love it if you could join my telegram channel here. I post educational content, as well as entries and exits to my trades. Thanks in advance.🤓
Neo let's get into the analysis.
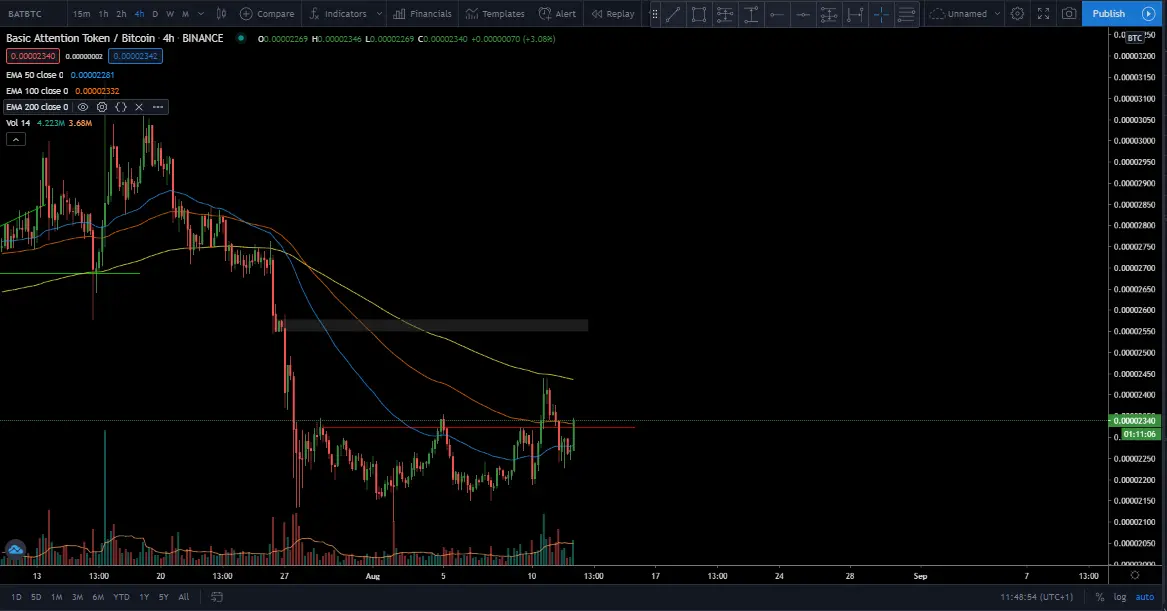
Now usually, I'd analyse the USD chart of the coin I'm doing an analysis of. But with the Dollar Index dropping, it inadvertently affects any altcoins traded against USD or Tether.
To counteract this, I decided to chart the BTC pair today.
And boy does it look great.
I took an entry on this earlier today, and I'm aiming for the highs. But essentially, price reclaimed the resistance (red), and is now moving upward to test the resistances ahead.
This is following a massive correction on the BTC pair, which is to be expected given the volatility of Bitcoin.
Now I won't solicit that anyone enter a position now, but if you're already in a position, this might be a good time to hold on to it.
I have been shilling BAT for over 3 weeks now, and I must have gotten through to someone.
Here's what I won't like to see:
- Price falling back to test the red line, and then breaking it to the downside.
- Price losing EMA support.
- Volume decreasing on reclaims of levels.
Seeing any of these formations is an instant out signal for me.
However, should price go my way, I would be targeting the upper supply zones, as well as 2600 and possibly 3000 sats if I'm given a chance.
Remember, none of this is financial advice!
Thanks for reading!






