
In below post, I have shared an analysis regarding LUNC using fibo MAs:
https://www.publish0x.com/paradoxal-investment/lunc-example-with-magical-fibonacci-numbers-xddrweg
It was the first time price crossed over 377 MA (1-Hour Chart) and it also touched on 610 MA and got rejected.
That was the time when I was writing my post.
Let's review what happened next:
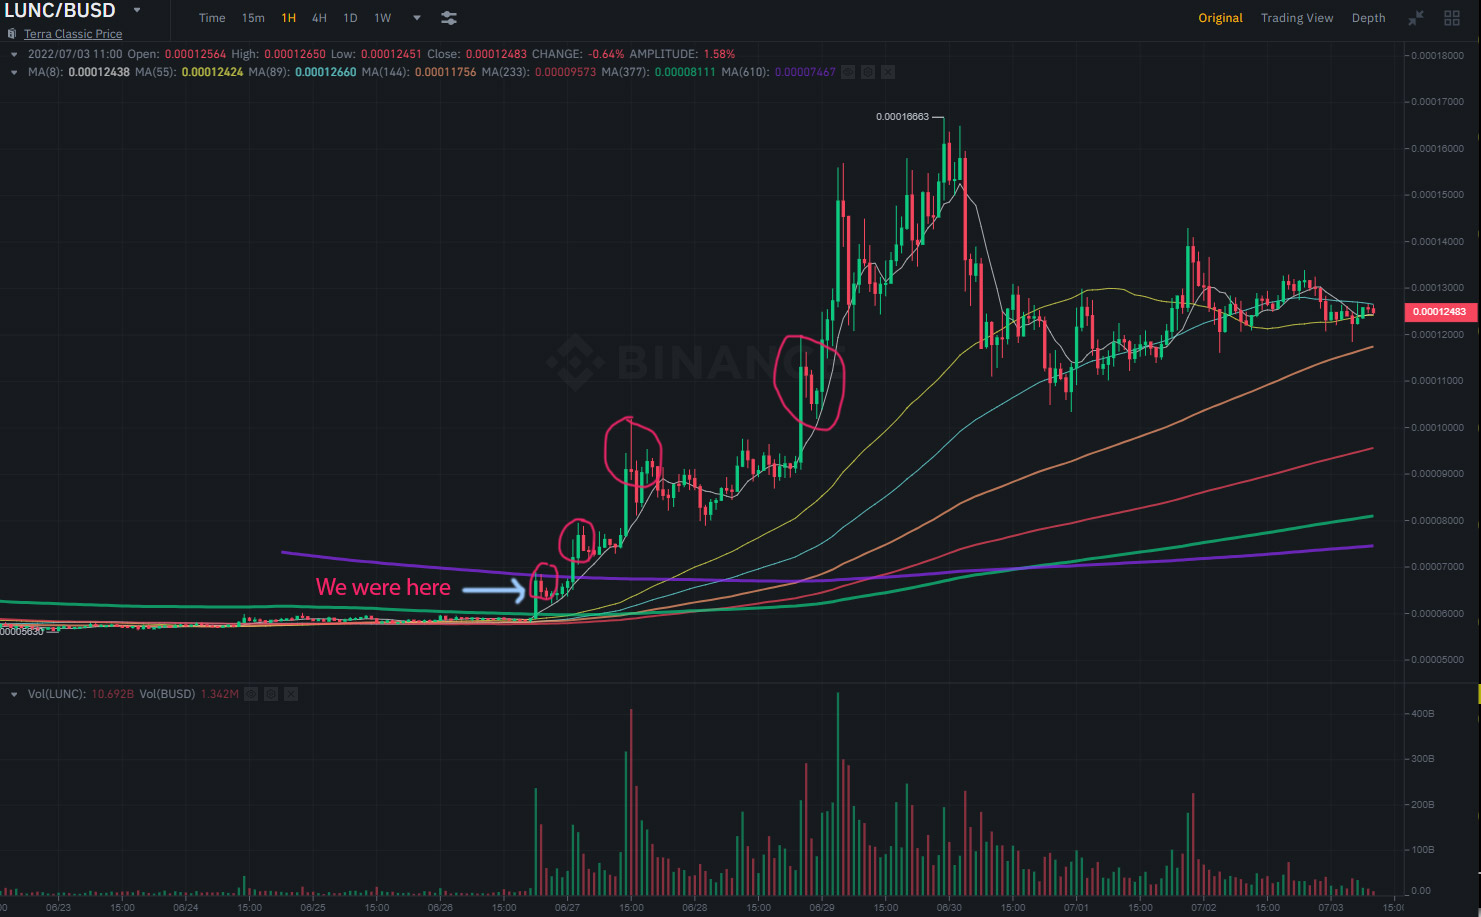
As you can see instrument gave an outstanding performance after first cross over. As drawing multiple pennant formations (see red circles) it performed a sharp rise. From 0.000060 to 0.000165 in just 4 days (rougly %180)
Even I was not expecting this sharp rise, so I sold my LUNC with average cost of 0.000115 and then watched it levitates :(
But at the end, it was a great example how FIBO MAs work perfectly. And let's not forget this is only hourly chart! What if these crosses occur in daily or weekly charts? We talk about lambos and moon, right? ;)
(But don't forget to be extremely patient in these kind of situations, otherwise you would only watch the rise and wipe your tears)
Finally let's look at daily chart:

Just because it's a fresh instrument, we have only 8/21/34 MAs. It looks like 21 MA crosses 34 MA over and in general momentum looks strong. There is kind of a pennant formation, but I can not be sure if it is real or a trap, so I would wait and see what happens! If it works as a pennant we can assume that rise can continue until 0.00025, even to 0.00030! (Not a financial advice)






