
In my first post here in Publish0x I have talked about using fibonacci numbers on moving averages:
Using Fibonacci Numbers on Moving Average
Today I want to show you brilliant work of this method on Luna Classic.
Let's take a look at below chart (LUNC/BUSD 1H Chart)
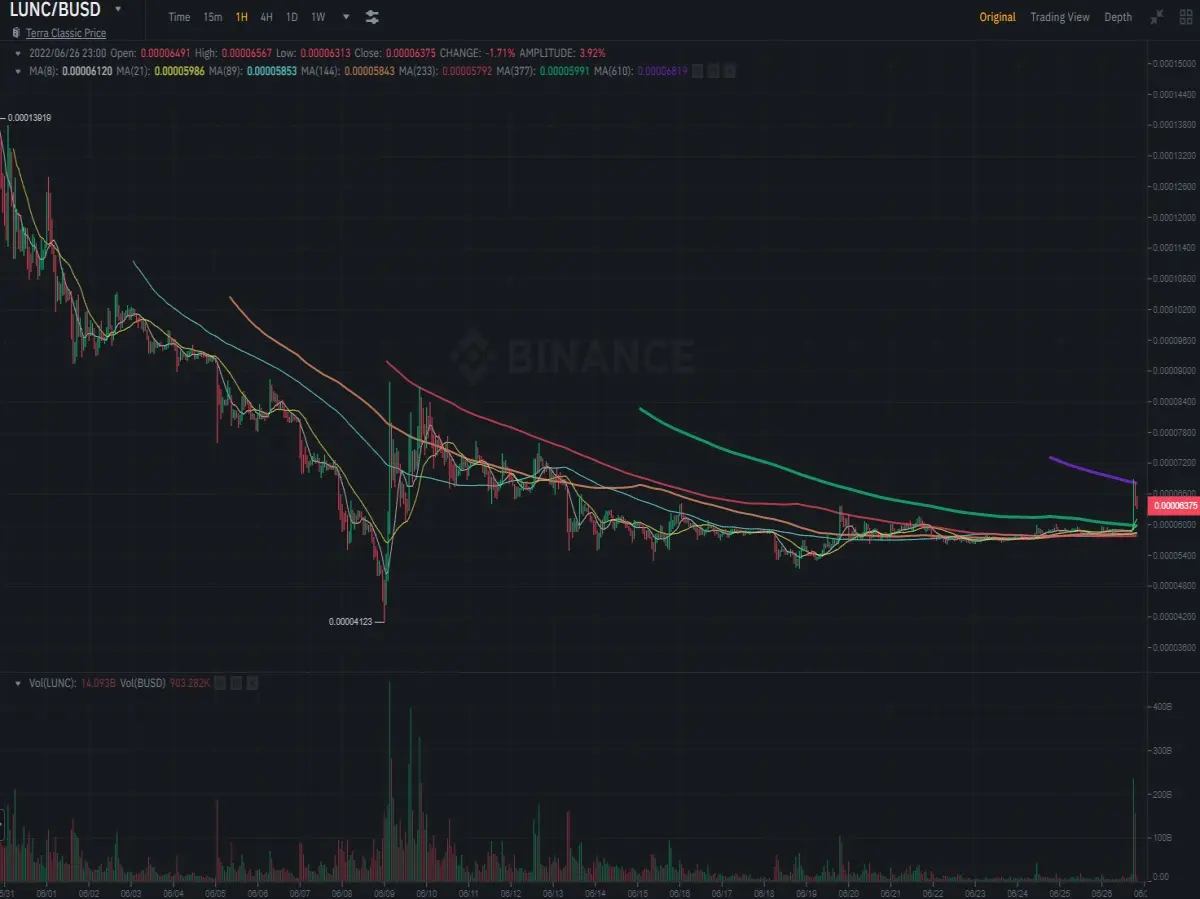
It's a regular chart with only MA and volume indicators. Only difference is we use fibo numbers for MAs!
Let's take a closer look:
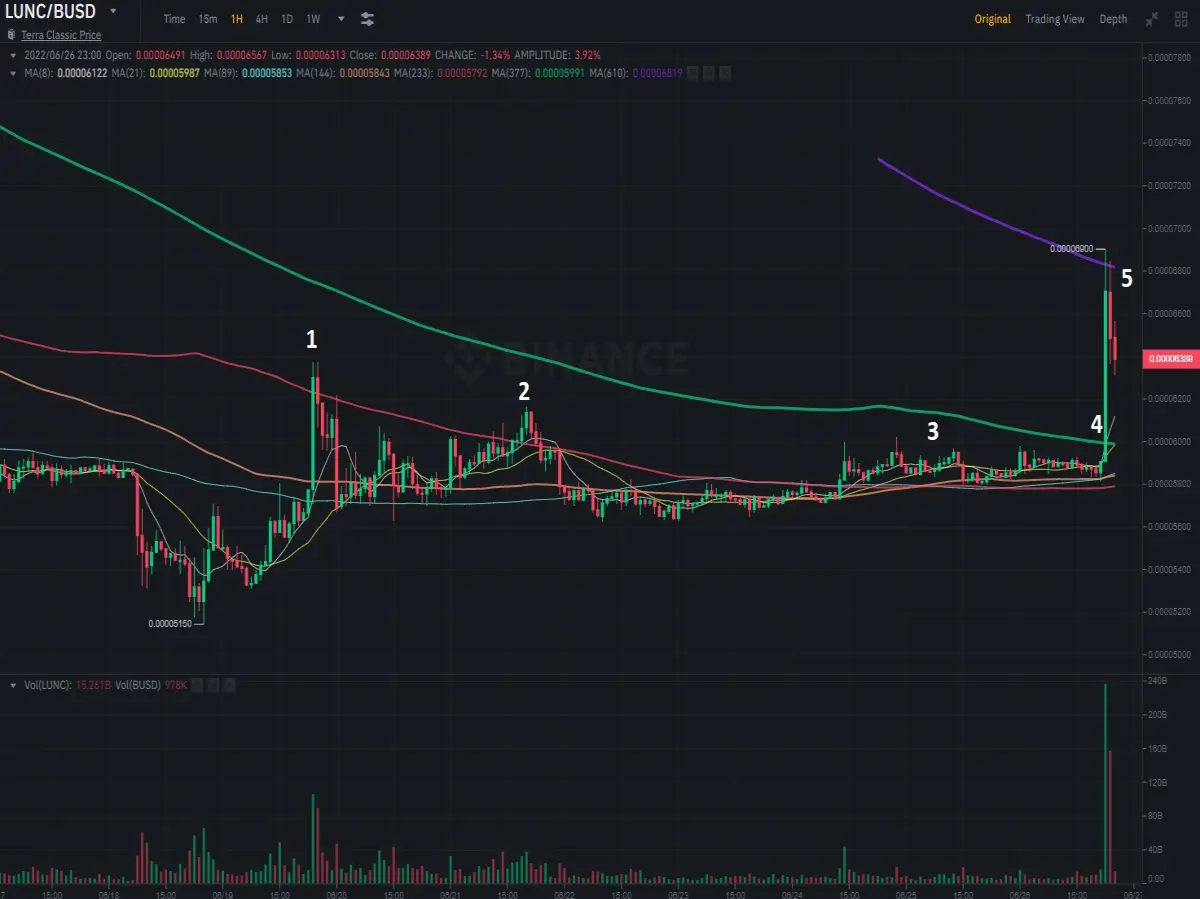
As you can see, after a long downtrend it tried to break resistence of MA 233 two times but couldn't achieve (see 1 and 2)
When exceeded and achieved to stay on it it was getting ready for moving upward! (see 3)
Finally when it crossed MA 377 today , it broke in first attempt and with a strong move it drew a big green candle! (see 4)
Big green candle (and following one) rejected by a strong MA resistence. (see 5)
Guees what? It's our 610 MA!
So that's it folks, you just saw a great example which fibonacci numbers in action!
Thanks for reading and tipping!
Chart images: Binance






