
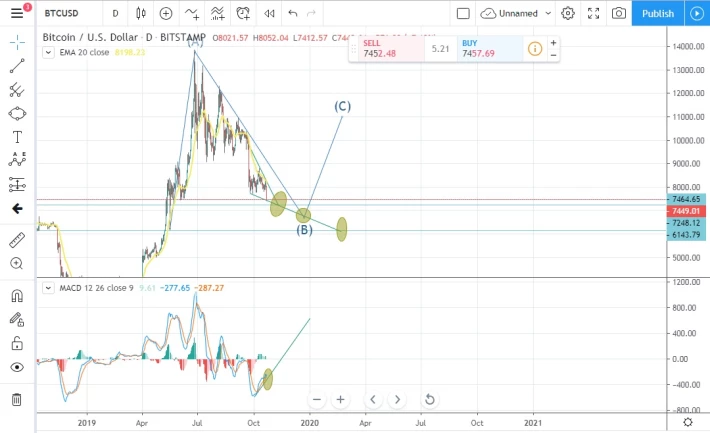
Bitcoin/USD Bitstamp
On this graph we use Elliott Correction Wave (ABC) with Ellipse tools and trendline
MacD on bottom.
For the Past few months bitcoin tested 5x $7.8k price and that's not good and now they break it.
If you check the graph there's a big correction on it and we expecting to go below $7200, $6700 to $6200 check the ellipse tools.
For me the main reasons are: Price made a fake breakout of resistance level,T'A said they will go up to $9k but it was a fake bull run it only hit the $8.6k.
Key level coincide with sell zone already break which is 8k.
We put 3 strong resistance
But we will see what happen next.
The downtrend is characterized similarly to an uptrend — but in the opposite direction.
Friendly reminder always do your own research
Remember: TECHNICAL ANALYSIS is all about probabilities and based on previous market performance(not all about certainty)
Disclaimer: This is for educational purposes,it is not intended as a financial advice.
The analyst won't be responsible for a loss of fund. Trader should be able to manage risk.
#Trend Analysis
#Chart Patterns
#Wave Analysis
Support us on our facebook page: https://www.facebook.com/BlockchainDCT/
Thanks a lot!






