
Trend continuation plays are some of the best and most reliable trading patterns available. These plays are often a trader’s bread and butter, and are the foundation of a complete trading system. All traders and analysts should be very familiar with the dynamics of continuation patterns, as a solid understanding of these concepts is essential to success in trading.
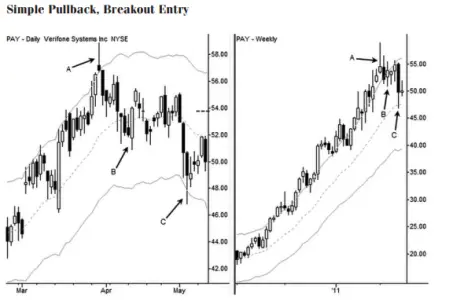
image from the book called pcm_broker(wiley finance)
A.a small climax on the daily time frame (left pane) marks the end of a multiyear uptrend. Please notethat the weekly chart (right pane) is grossly overextended, with many bars touching or exceeding the upper band, and two free bars prior to A. This buying climax on the weekly chart sets the stage for a short sale on the daily
B.The daily chart clearly illustrates the two-legged complex correction into point B, followed by a failed breakout attempt to continue the uptrend. Any trader considering a purchase of this market at point B should have been worried about the overextended weekly chart at this level.
Entry The actual entry was on the last bar of the daily chart, preferably when it broke below the low of the previous bar. This is a situation where information about the intraday chart can be gathered from the daily chart. The second last bar in the chart represented a small buying climax on the intraday chart (which is not shown here). The reversal on the next day, our entry, reversed this buying climax and broke below several levels of support
Stop An initial stop was established just under 54.00 (the small dotted line), with the plan to quickly adjust or exit the trade if there is no follow-through. A break like this should see immediate and sharp continuation.
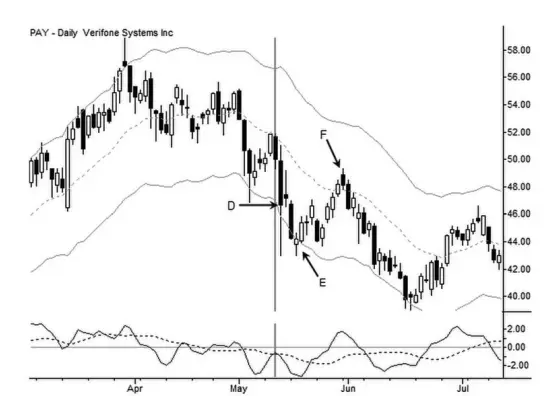
Image from the book called pcm_broker(wiley finance)
However, a news event occurred on this stock during the intraday session, causing it to move far beyond the 1× profit target and close to the second target. While risk management in an active market such as this one can be done through intraday patterns, one must be careful not to trade within the insignificant noise of those time frames
E.A try to get through the lows will fail (see failure test at E), and most swing traders would have been stopped out of this trade a few bars after E, with a significantly tightened stop.
F.There may have been a possible second short trade entry following another larger complex consolidation, but this trade is just slightly out of the scope of the swing trader looking for the most straightforward and clean possible trades
Conclusions This example has shown what looks to be a simple bear flag type pull-back, but the bigger picture of reversal from a parabolic uptrend in the higher time frame adds confidence to this trade. Additionally, although there were opportunities for re-entry and holding periods
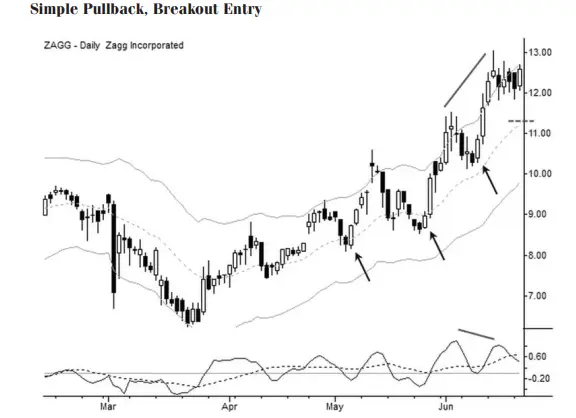
Image from PCM_(Wiley Broker)
SETUP.The current entry, at the right edge of the chart, has three warning signs: it is a divergence after at least the fifth leg in an uptrend, there is a momentum divergence on the MACD, and the stock is slightly overextended in a potential buying climax
Entry The actual entry was on the close of the bar that broke above the previous day’s high. There were other formations that could be seen on lower time frames, but volatility was compressed, as seen by the ranges on the previous bars, and it was sufficient to take a simple breakout exit on close.
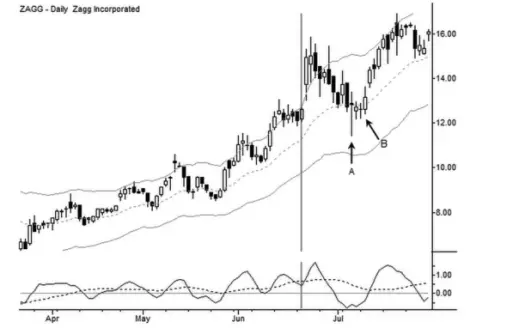
Many traders would have been tempted not to take partial profits here, or even to add to their positions, with the hope that the news would propel the stock into a new, steeper uptrend. While this is always possible, this is not what normally happens. Normally, large gaps such as this lead to volatility; selling some of the position
A.Following one very strong session, the stock started a pullback or a decline that culminated in the volatile session labeled A. Note this pattern: A session with a long shadow in the direction of the preceding swing is usually a small climax. In this instance, a selling climax was evident on the intraday charts.
B.Although not the point of this example, another long position could have been entered on a breakout of the small days following the selling climax. Think about the bigger picture: this stock was moved higher on news, started a multiweek pull back that ended in a selling climax, and then spent two days in volatility compression. At this point, the stock was potentially primed for a directional move, and another long position was justified. Last, note that this leg ran into some resistance just under 16.00, which was approximately the high of the June spike





