
Market analysis of several high-performance coins suggests large market cap rank changes may act as signals for near-or-mid-term value increase. Large jumps in Solana's, XYO's, and Terra's 2020-2021 monthly market cap rankings were each followed by massive price rallies one or several weeks later. Similar analysis of Algorand and Avalanche however suggests this price signal fades for coins with very large initial market cap rankings.
Background and hypothesis
"Coin market cap" at face value is a straightforward concept; multiply a coin's circulating supply by the value assigned to each coin by the market, and presto -- we can describe a coin's hypothetical total worth. This simple definition reduces market cap to a result, not a predictor, of coin price.
Several months into my crypto hobby however I noticed that while a coin's market cap value rose and fell with its price, the coin's market cap ranking against its peers did not always reciprocate. I wondered what it might mean for a coin to rapidly change its share of the total cryptocurrency market cap, and how such behavior might eventually get reflected in its price.
I decided to investigate a simple question: did 2021's high performing coins signal their price advancements through equivalent jumps in market cap ranking?
I subjectively chose five coins which I knew experienced rapid value increases in 2021. These five and their market cap rankings as of this post's publication are listed below:
- Solana (SOL; 5th)
- Terra (LUNA; 10th)
- Avalanche (AVAX; 12th)
- Algorand (ALGO; 20th)
- XYO (XYO; 149th)
Data sources
Coinmarketcap.com maintains a public archive of historical coin market cap rankings. I wrote a Python web scraper to extract the top 1000 coin market cap rankings from January 2020 through December 2021.
Daily coin price histories were manually downloaded from investing.com.
Coins of interest rankings and prices
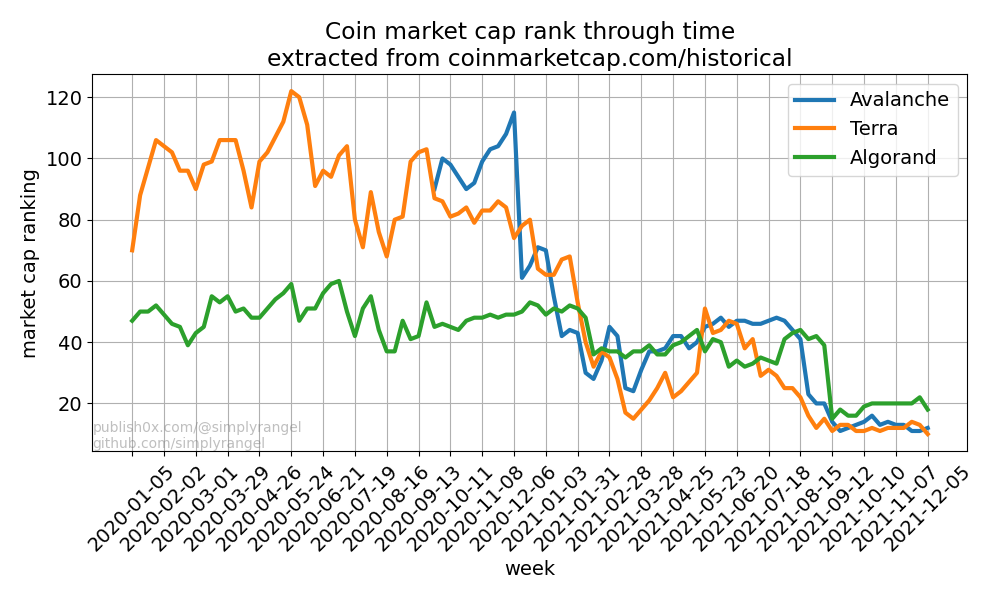
Each of the five coins of interest grew rapidly in market cap rankings over the past two years. LUNA and AVAX both spent some time in 2020 with market cap rankings above 100 before steadily descending to their current 10th and 12th rankings, respectively. ALGO's market cap rank hovered around 50th until Jan. 2021, when it dropped a dozen or so places before abruptly entering the top 25 in early Aug. 2021.
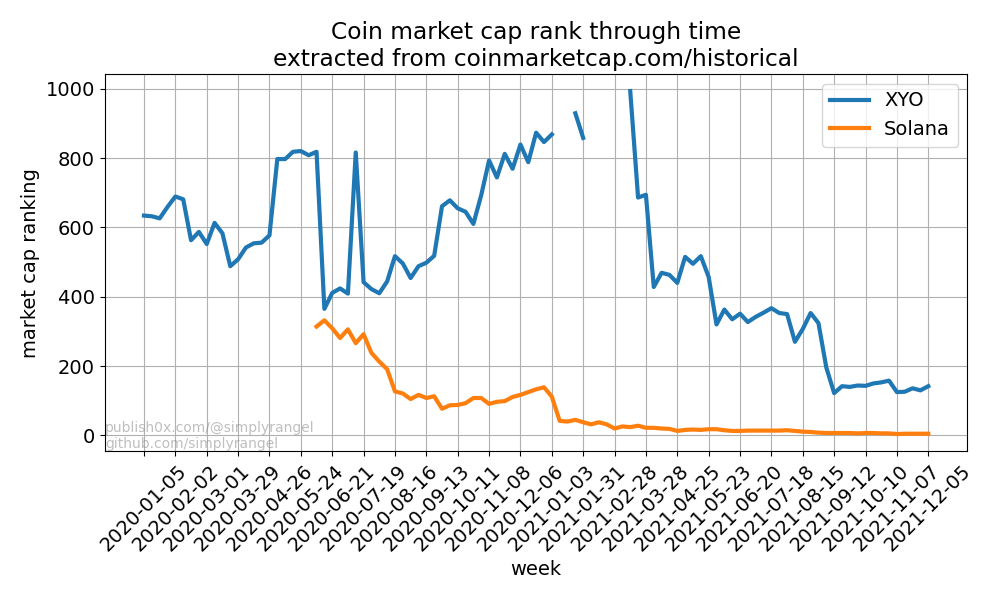
XYO and SOL experienced the largest jumps in market cap share. XYO wasn't even within the top 1000 coins Jan. 2021 before it rapidly advanced over 800 peers to its current 149th spot. SOL started around 300th in early 2020 before experiencing two massive jumps in relative market cap share.
These described market cap ranking behaviors are plotted below. XYO and SOL are plotted separately for easier viewing.
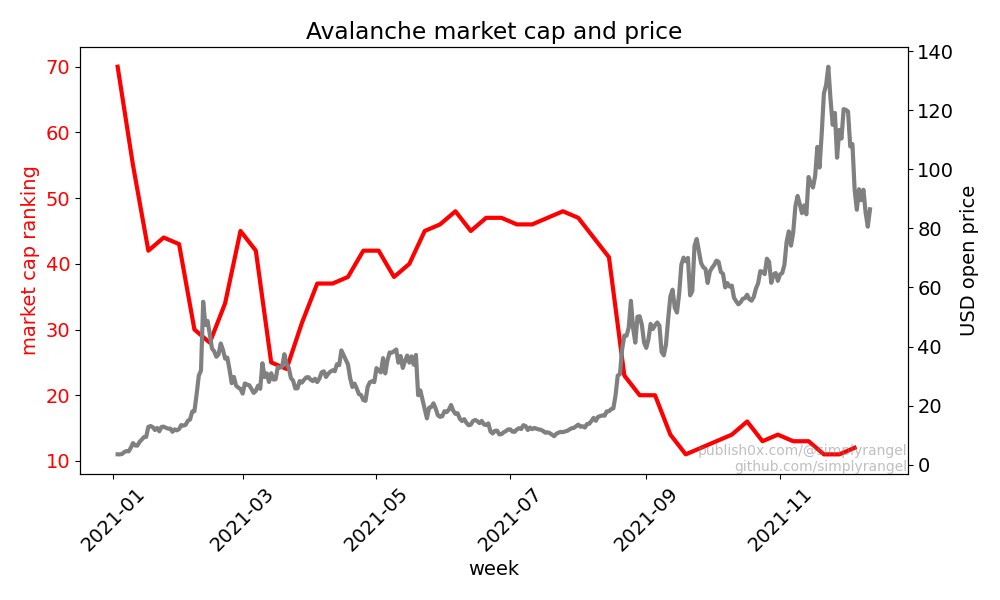
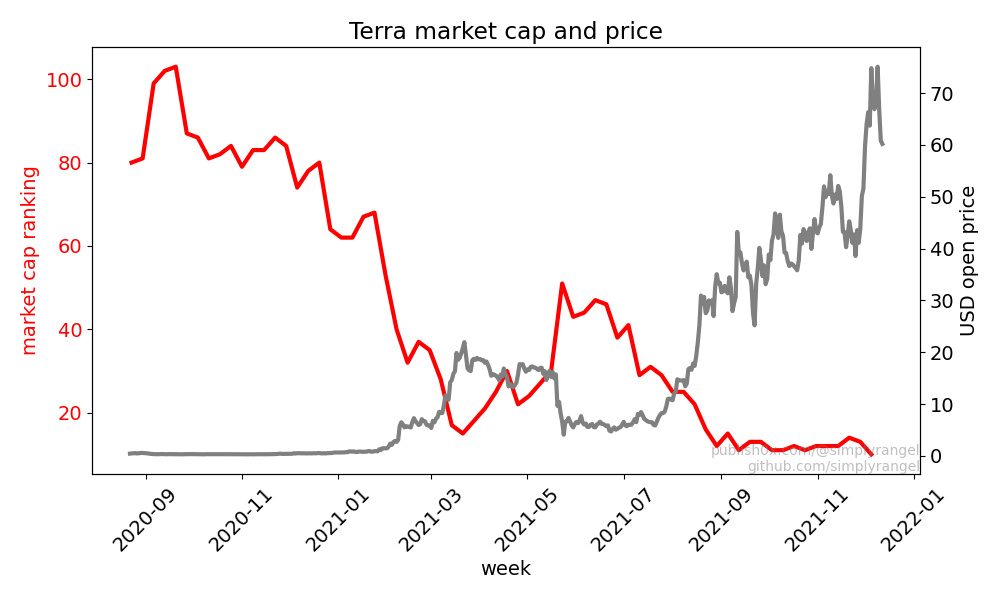
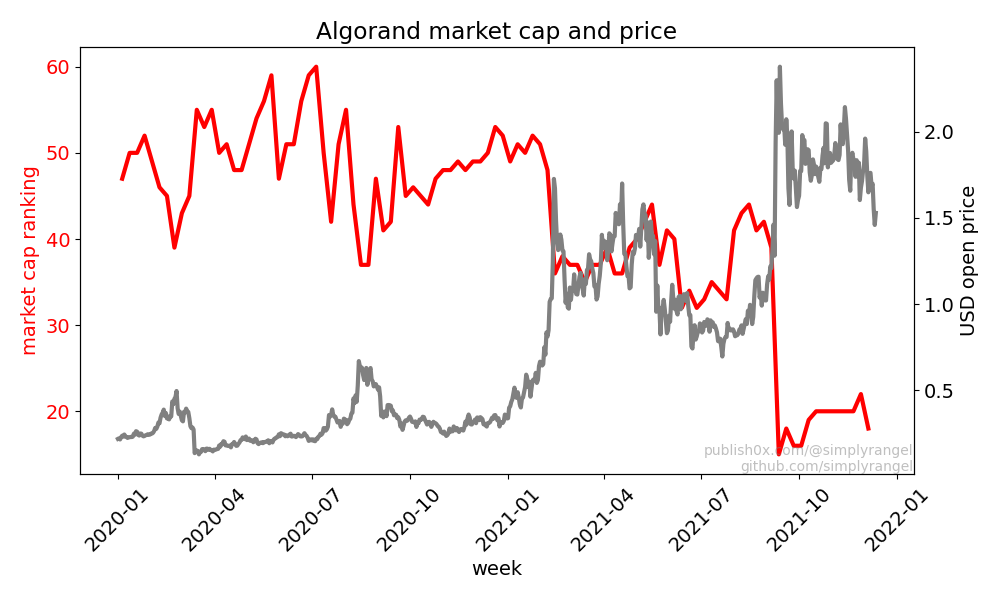
We can get a visual idea of how each coin's price might react to its market cap rank by plotting each parameter vs time on the same graph. The plots below accomplish this with the following setup:
- A coin's market cap rank relative to the left-hand Y-axis is traced in red
- A coin's daily opening price relative to the right-hand Y-axis is traced in gray
- Both the market cap rank and opening price (red and gray traces) vary by date and share the same X-axis
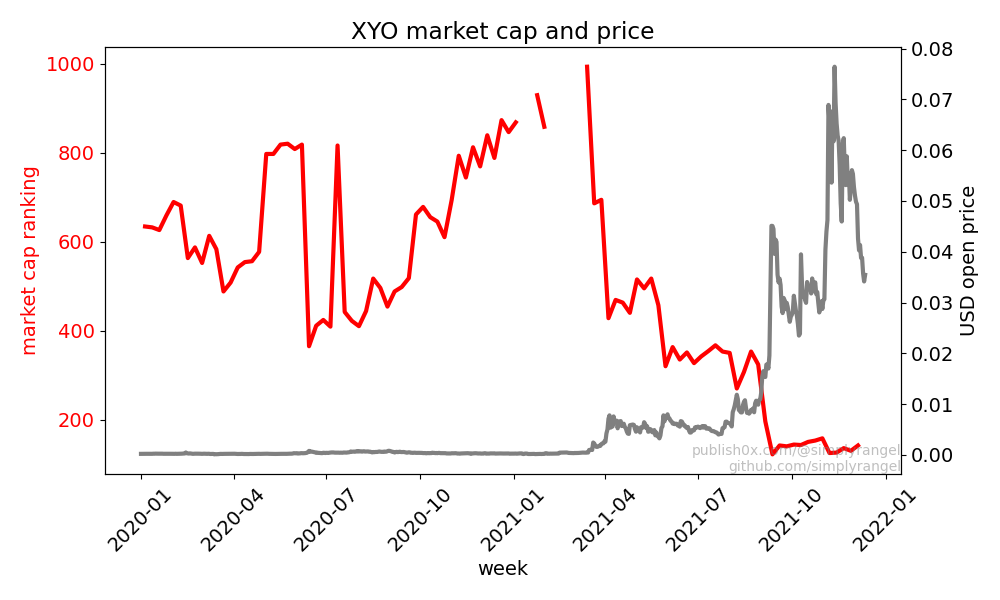
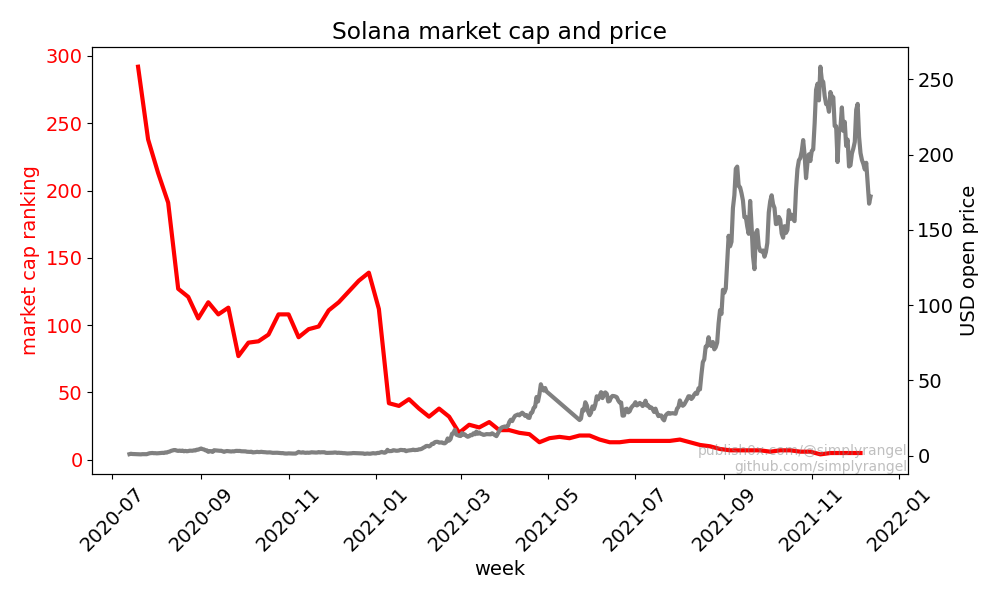
A couple of things immediately jump out:
- XYO and SOL both experienced massive jumps in market cap share weeks before massive multiple-x price rallies. XYO's market cap rank jumped nearly 700 spots between Jan. 2021 and April 2021 before its coin price rallied by several hundred percent. And SOL's rank moved from near-300 sub-50 between July 2020 and Jan. 2021 before it's price also rallied by several hundred percent. The hypothesis that rapid jumps in market cap rank signal future price rallies is bolstered by these coins.
- AVAX and ALGO experienced market cap rank jumps at nearly the same time as their massive price rallies. The hypothesis is null for these coins.
- LUNA (marked as Terra on the graph) experienced a subdued version of XYO's and SOL's behavior.
Switching out the left-hand Y-axis' market cap rankings data for market cap ranking change every two weeks and every four weeks produces a more insightful series of graphs. We'll display XYO's and SOL's data this way since appear to offer the strongest correlation between market cap rank advancement and future price increase. Note that negative market cap ranking changes are "good" because they mean the rank has decreased -- in other words, that the coin has increased its share of the crypto market.
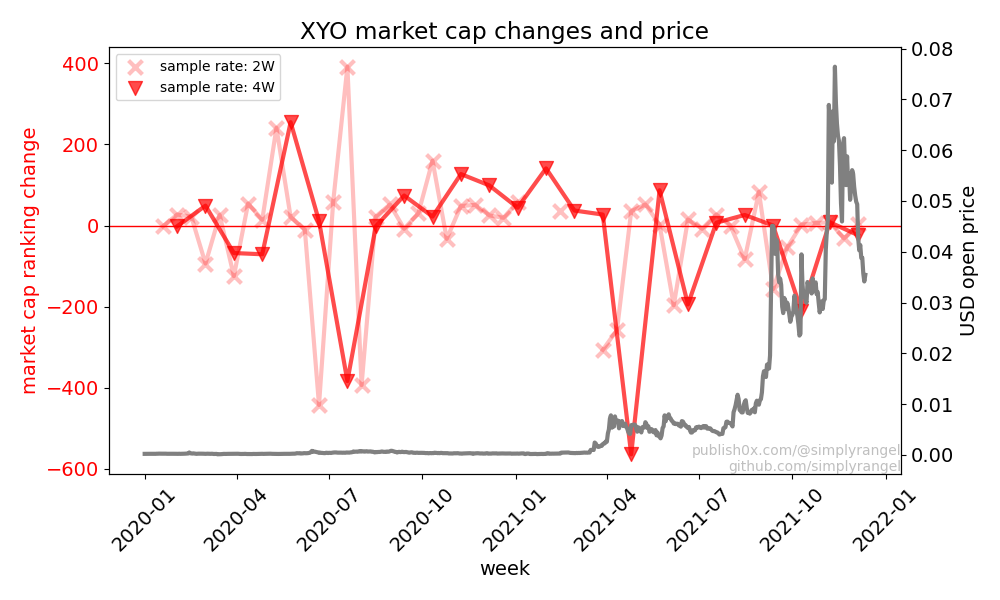
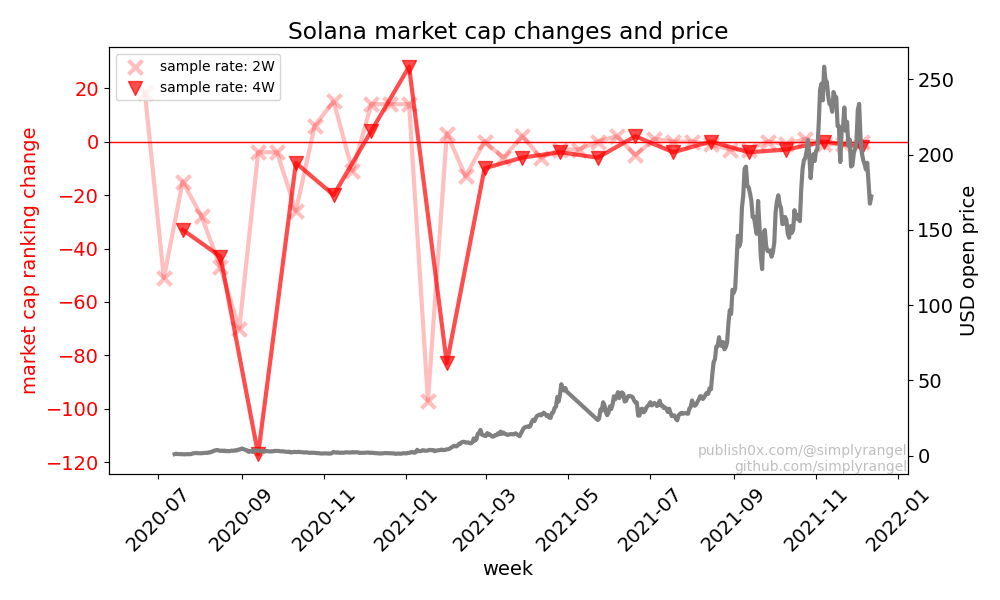
The XYO and SOL plots are compelling. Both show massive monthly advances in market cap rank (the extended red "V"s) were followed by massive price rallies.
Final thoughts
The presented analysis suggests a compelling link between market cap rank changes and near-or-mid term price rallies. I'm concerned however that these results are heavily skewed -- I chose these coins with knowledge that they performed very well over the past two years, so there is definitely some confirmation bias baked in. I plan to perform the same analysis however on coins I have no prior knowledge of. I'll update the community on whether the results offered by XYO, SOL, and LUNA hold for a larger subset of coins.
If future analysis gives these results confidence, I'm puzzled why such a strong a relationship between market cap rank and price increase exists. A coin's increased share of the overall crypto market intuitively should result from an increase in its price; AVAX and ALGO depict this behavior well. But the XYO, SOL, and LUNA plots show this is cause-and-effect relationship is reversed.
Please comment on your thoughts below. Critiques, suggestions, and encouragement are always appreciated.
Thanks for reading!


