
Market cap rank changes signaled upcoming bullish price movements for a significant number of 2021's most profitable cryptocurrencies. Weekly market cap rank changes greater than 20 percent occurred an average of about one to 50 days before the daily opening price exceeded 1.75x the price's 30-day rolling mean.
I continued my analysis of Terra's, Solana's, and XYO's 100+ percent price rallies in 2021 and their sensitivity to large market cap rank changes -- read PART-1 and PART-2 for details. Part-3 of this series generalizes the analysis techniques explored with Terra, Solana, and XYO and applies them to 33 coins.
Analysis recap and data sources
PART-1 and PART-2 of this series discussed the hypothesis that large jumps in coin market cap rank may signal near-to-mid-term bullish price movement. Solana's and XYO's market behavior provide confidence that this hypothesis has merit, however the hypothesis broke down to various degrees with other considered coins.
Coinmarketcap.com maintains a public archive of historical coin market cap rankings. I wrote a Python web scraper to extract the top 1000 coin market cap rankings from January 2020 through December 2021.
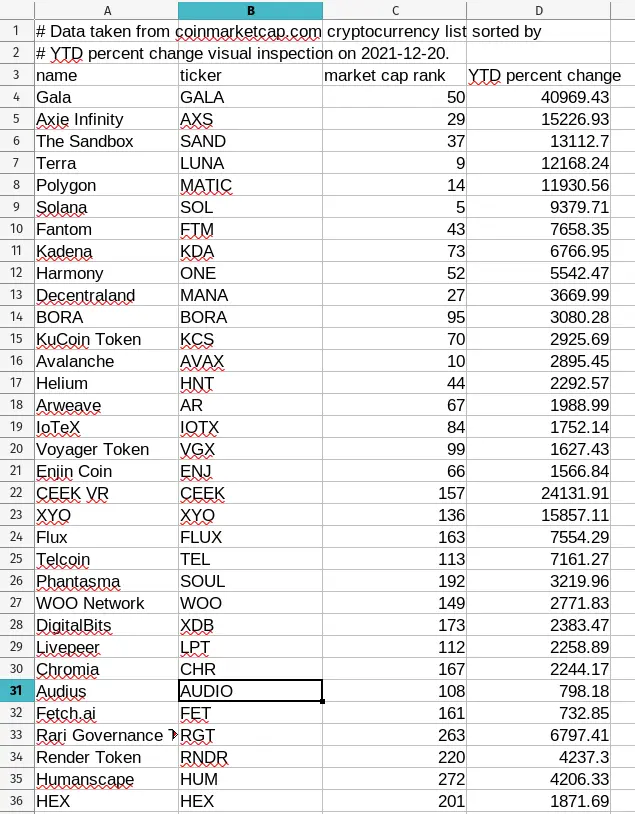
The top 300 coins by marketcap were sorted by year-to-date performance on coinmarketcap.com's home webpage. I subjectively chose 33 coins from these 300 sorted coins. A screenshot of these 33 coins in a spreadsheet is shown below.
Daily coin price histories starting Dec. 2020 were manually downloaded from coingecko.com.
Mapping CMC rank change to price behavior
I performed the following analysis on each of the 35 high-performance coins:
- Identify the weeks where the coin's market cap rank weekly percent change exceeded negative 20 percent or more (note that "negative" rank changes denote movement up the rankings). I'll refer to these dates as "rank change exceedance events", or RCEV for short.
- Identify the dates where the coin's daily opening price exceeded its 30-day rolling mean by at least 1.75x. I'll refer to these dates as "30-day rolling mean exceedance events", or RMEV for short.
- Identify the most recent RCEV date that occurred before each RMEV date, and calculate the number of days between the two dates. I'll refer to these days as "deltas" for short.
- Plot the deltas for every coin in a histogram and visually inspect it. If CMC rank changes signal future price jumps, I'd expect the histogram to either resemble a uniform distribution with a small range, or a cluster of values with some outliers.
There's a lot of subjectivity in the analysis flow outlined above -- particularly the -20 percent cutoff used to calculate the RCEV dates, and the 1.75x cutoff used to identify the RMEV dates. I played around with different cutoff values for both and settled on -20 percent and 1.75x because they produced the most usable data for me.
Analysis example: Terra (LUNA)
I'll briefly run through the analysis process for Terra. Terra began 2021 as the 62nd largest coin by market cap. Terra was rank 10 by Dec. 12, 2021 when I generated the datasets used for this analysis. Terra experienced a whopping 12168.24 percent YTD value change by Dec. 12, 2021.
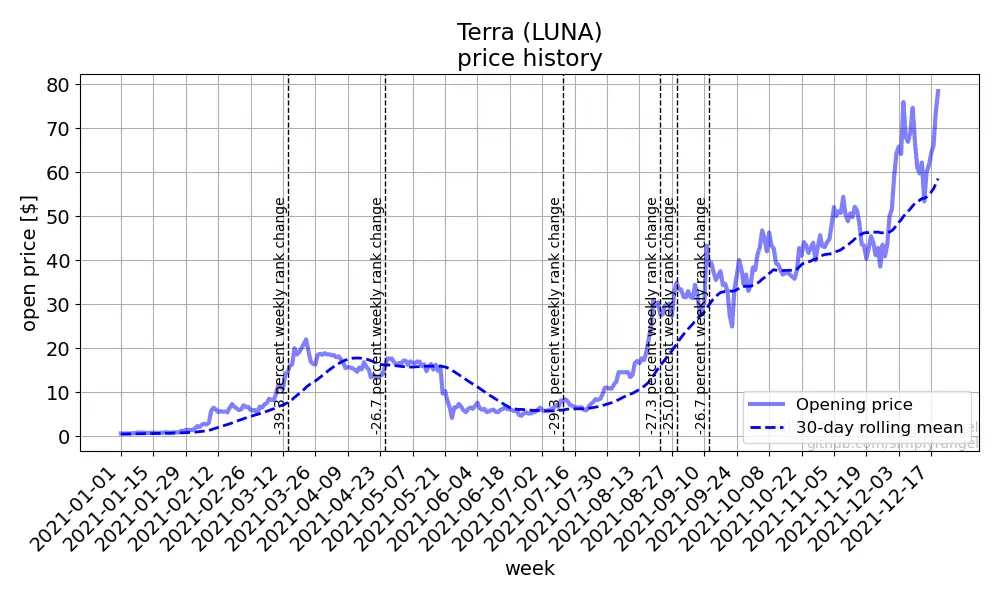
Below is a plot of Terra's daily price history for 2021 coplotted with its 30-day rolling mean. Vertical dashed lines show Terra's RCEV dates on this time range.
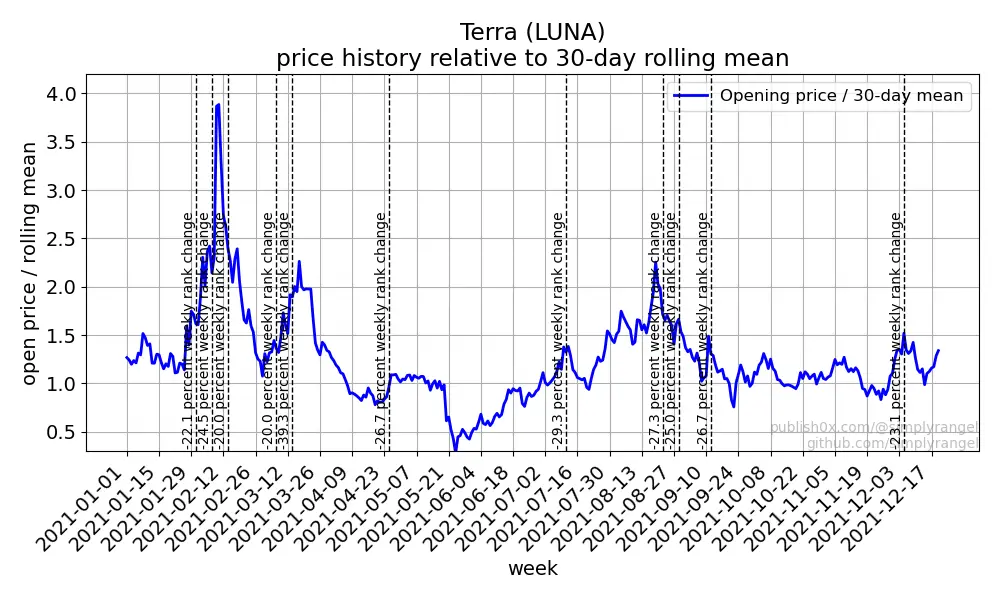
We can divide the opening price by the 30-day rolling mean to get the following non-dimensional plot.
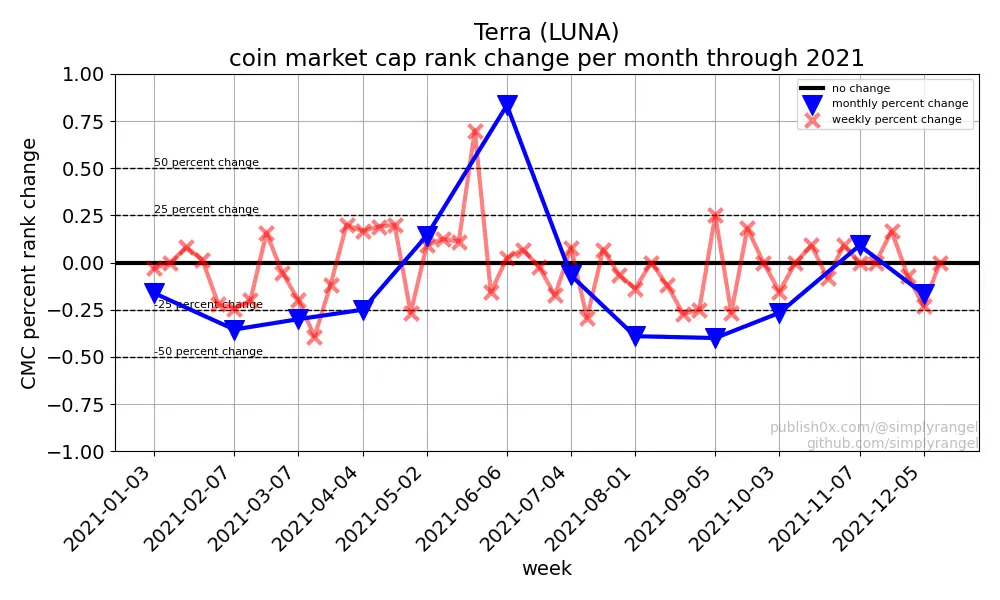
I took Terra's weekly market cap rank and calculated its weekly and monthly percent change -- the results are plotted below.
The analysis flow produces three instances where Terra's price exceeded 1.75x its 30-day rolling mean. These RMEV dates and their deltas from the nearest RCEV date are described below:
- On Feb. 2, 2021 Terra's price exceeded 1.75x its 30-day rolling mean. Terra's cmc rank changed more than -20 percent two days earlier.
- On March 13, 2021 Terra's price exceeded 1.75x its 30-day rolling mean. Terra's cmc rank changed more than -20 percent six days earlier.
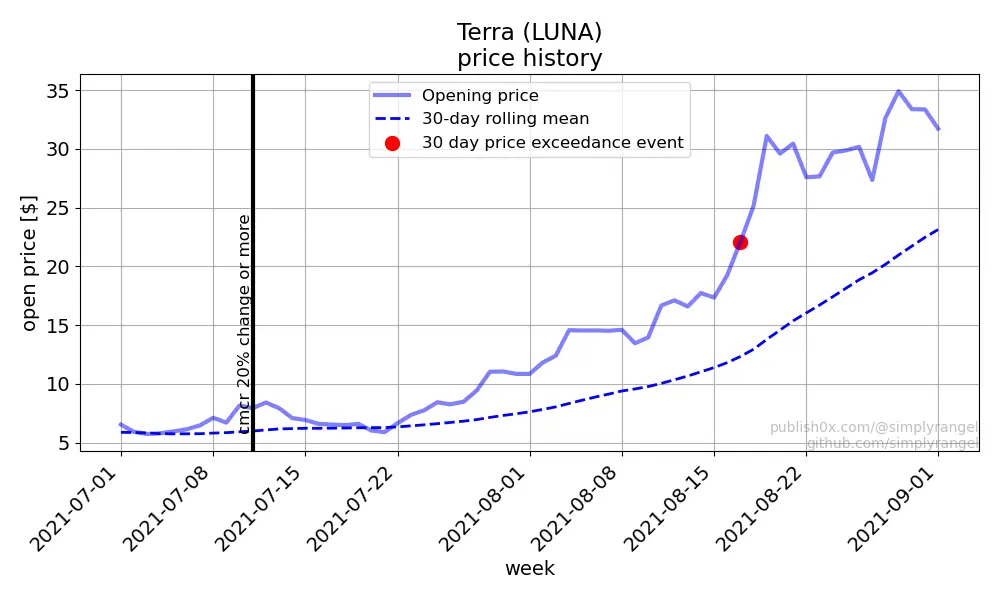
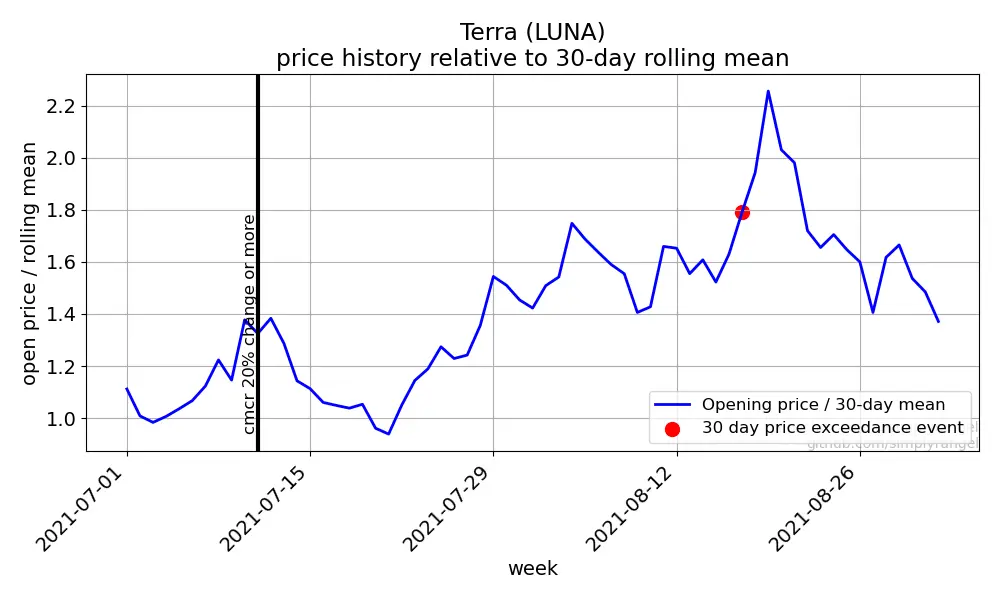
- On Aug. 17, 2021 Terra's price exceeded 1.75x its 30-day rolling mean. Terra's cmc rank changed more than -20 percent 37 days earlier.
The two figures below show Terra's price history vs time, and price history relative to the 30-day rolling mean vs time, during the Aug. 17 instance.
Analysis results
The analysis flow applied to the 33 considered coins produced a histogram whose deltas' distribution resembled a lognormal distribution. In other words, the majority of the deltas were clustered between 0 and 50 days, with a rapidly diminishing distribution as the days increased.

This distribution behavior matches well with what I'd expect if a relationship between CMC rank change and future price behavior exists:
- When any of the 33 coins experienced a 1.75x price increase over their 30-day rolling means, they were most often preceded by cmc rank changes of at least -20 percent between 0-50 days before.
I generated the same histogram for only several coins of interest -- XYO, Solana, Kadena, Terra, and Polygon. I'm very familiar with these five coins' price movements so they serve as an unofficial "benchmark".

Discussion and future work
These are very compelling observations, but a lot of work remains to show they describe a an actual relationship between coin market cap rank changes and price jumps and not just a spurious relationship. As my engineering professors loved to say, "correlation does no imply causation".
I'm also pushing the envelope on what analysis I'm capable of doing as a hobby. My code base is getting large and the analysis steps continue to grow -- all of this introduces more potential error sources that might creep in. I'd love it if any readers could provide critiques, comments, or sources for similar analysis.
As always, I hope you enjoyed. Thanks for reading and good luck with the new week!






