
MONERO (XMR) is a unique crypto with its stealth address feature which makes it more prominent among top 20 cryptocurrencies and tokens however I am not going to discuss its feature, fundamentals or news rather I am posting pure technical analysis of XMR.
The price action move:
The priceline of XMR has formed a bullish BAT pattern if we see the dimensions then after X to A leg the A to B leg is retraced up to 0.886 Fibonacci and B to C leg is projected between 0.382 to 0.886 Fibonacci as required for BAT pattern and final leg is between 0.786 to 0.886 Fibonacci projection of X to A leg and here the bullish BAT pattern is confirmed now we can set our sell targets between 0.382 to 0.786 Fibonacci projection of A to D leg but for more confirmation we can see some more indicators.
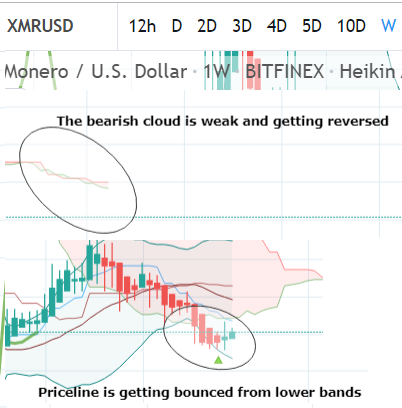
The price line is hitting the lower bands of bollinger bands and getting bounced and this is the 1st hit on bollinger bands support since after Dec 2018.
Ichimoku bearish cloud is turned weak and likely to be reversed very soon, here the priceline has strong chances to cross up the cloud.
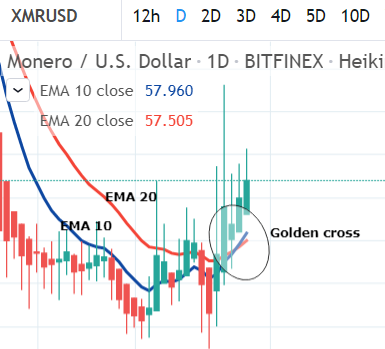
On day chart the exponential moving averages EMA 10 has crossed up the EMA 20 and formed a golden cross which has produced a bull rally of more than 30% and a price correction period is expected which can give us the chance to catch it again from the dip before the real bull move, we can understand the power of bullish move when this golden cross will be formed on week time period chart.
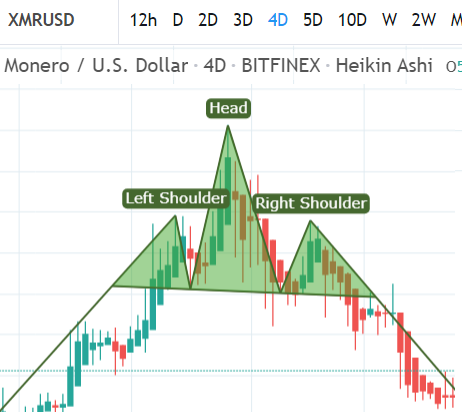
This golden cross has also invalidated the head & shoulder pattern formed on 4 day time period chart which could be a big hurdle for price action to move up.
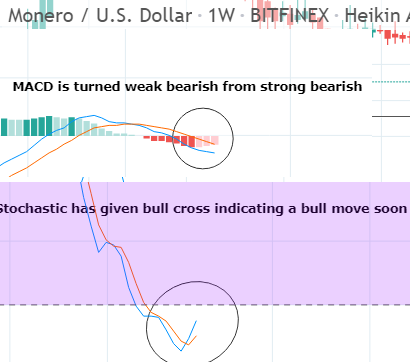
MACD is turned weak bearish from strong bearish and soon it will be turned strong bullish.
Stochastic has given bull cross which is a powerful indication of bull move soon.
As per Fibonacci sequence method the targets are as below:
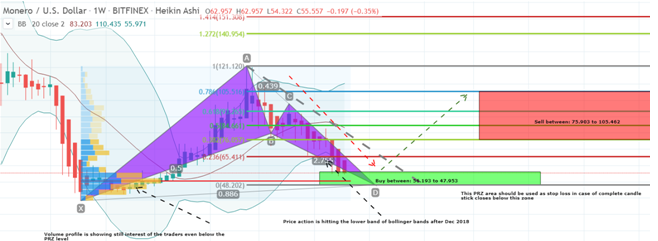
Buy between: 56.193 to 47.953
Sell between: 75.903 to 105.462
Regards,
Atif Akbar (moon333)


