
Today I am going to use two important terms to show you how to estimate the start and end of Bull Run or bear market: Death Cross and Golden Cross.
We can use moving averages to determine the trends by smoothing the prices over time and to spot trend changes. They are used extensively to form other indicators for example MACD.
Many analysts use 200 days Exponential Moving Average (EMA) to trace long term trend and 50 days EMA as a signal. When 50 days EMA crosses 200 EMA below, it’s called Golden Cross and shows that we are in Bull Run. When it crosses above it is called Death Cross and indicates that we are in a Bear Market.
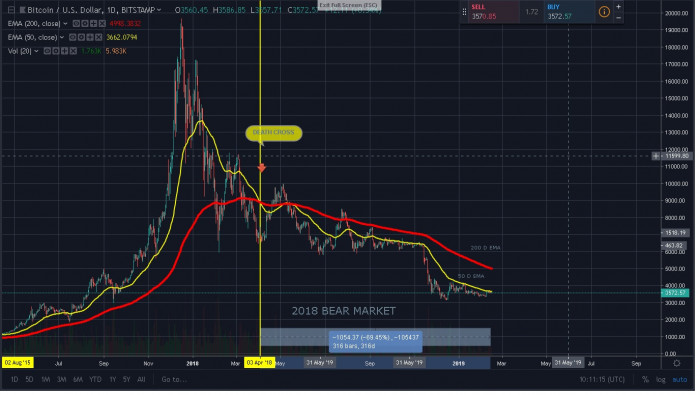
As you can see from the graph below, Bitcoin lost 81% of its value since all-time high Dec. 16, 2017. We can see the Death Cross on April 3, 2018. It’s been 320 days then. Have we reached the bottom? When is it going to end?
Let’s see what happened in the 2014 bear market. In fact, we see many similarities between the two graphs. The Death Cross occurred in April 2014. It lasted 475 days then we have a golden cross on Aug 2, 2015. Then price skyrocketed afterward.
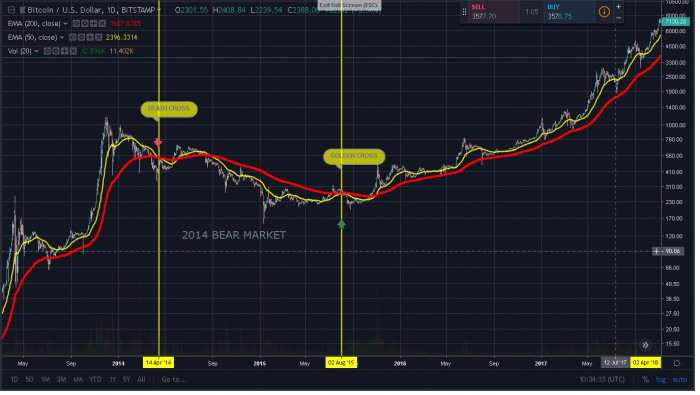
Comparing these two graphs, we get many insights. Does it show the possible end date for the end of Bitcoin’s bear market? If history repeats itself, this bear market will end on July 22, 2019. But who knows. In my opinion, we are going to see Bull Run at end of this year.
What’s your opinion? Please share.
Thanks for reading. I hope you’ve found it helpful.
If you like this content, tip me please with some BNTY or use one of the addresses bellow:
Sign up for Coinbase and get $10 Free Bitcoin:www.coinbase.com/join
*********************************
For Donations:
BITCOIN: 1Cnxd7EioNEdMQPD5SHNbNTWKdGy1Tft43
ETHEREUM: 0x6a94bFa9DCda27B7f26Fd09Ae297a5e59F70019c
Publish0x: https://www.publish0x.com?a=1YQdJWyeOG
To go to Binance: www.binance.com






