
Frameworks and calculations for trade are not as accurate as you think. So I made this framework that evaluates stock strength using both individual economic factors and nonlinear interaction terms. It uses a normalized scale of five levels (2, 1, 0, -1, and -2).
How are they represented: 2, 1, 0, -1, -2?
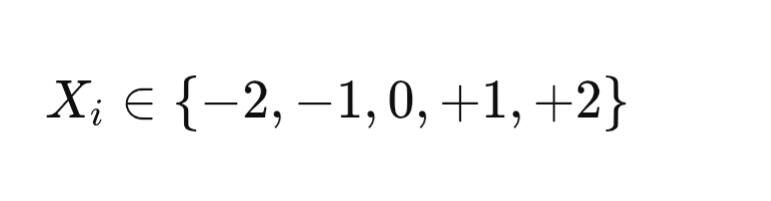
Each factor Xi is defined on a bounded sentiment scale:
You can see them like this:
2: Strong positive condition
+1: medium positive condition
0: Neutral / no effect
-1: Medium negative condition
-2: Strong negative condition
But how are they connected together in finance? And here we go with examples:
- When the confidence of investors is high, it leads to higher innovation.
- When revenue is high, it needs to lead to more profit. Because more money is entering the companies, more money needs to be given as a reward.
- It's like a cycle where all of them are connected.
Now let's return to the variables. How are they calculated?
Strong connection
When both of them are positive, for example:
New Product × Investor Confidence = 2 × 2 = 4
Highly positive.
But in other cases it's not like that, for example:
Profit × Revenue Growth = 2 × -1 = -2. If the profit is high but there's no revenue growth, it could lead to not-so-positive effects.
Now this one is the most important, and you should hear me out.
New Product × Investor Confidence = -2 × -2 = 4.
How they became positive. When both variables are negative, the model reflects compounded downside pressure, not the downside effect.
Now here are some others you should pay attention also to while calculating.
- Economic Conditions × Profitability
- Sentiment × News Impact
Now let's talk about the core of the model:
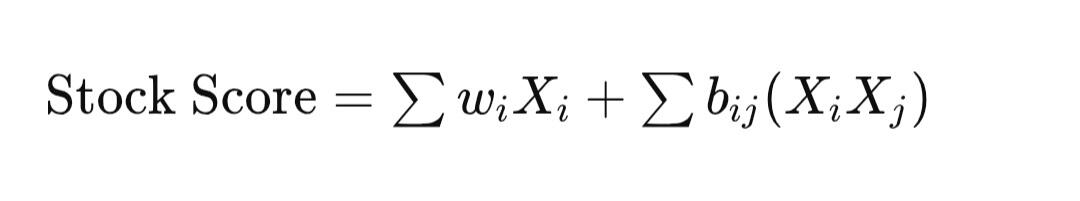
The stock strength score S is defined as:
Where you have to remember these.
- S = stock strength score
- Xi = financial or macroeconomic factors
- Wi = importance weights
- bij = interaction coefficients
- XiXj = nonlinear interaction between variables
Now that we have what we need, it's time for the math. Here are the formulas:
Interaction Mechanism
The interaction term:
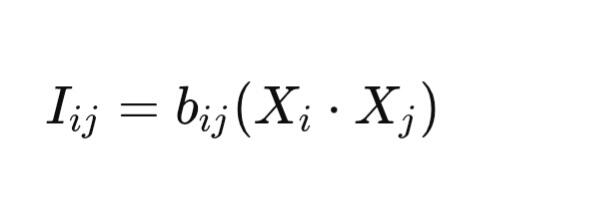
captures nonlinear dependencies between variables.
Data-Driven Method
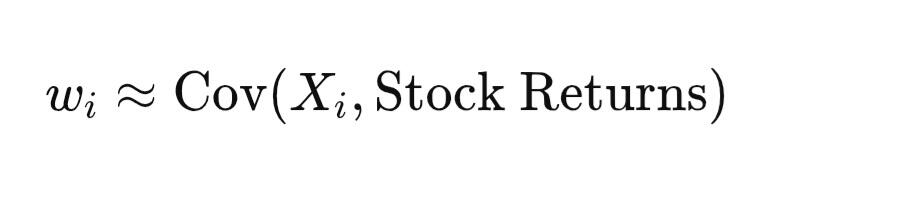
Weights estimated using historical data:
Regression Learning
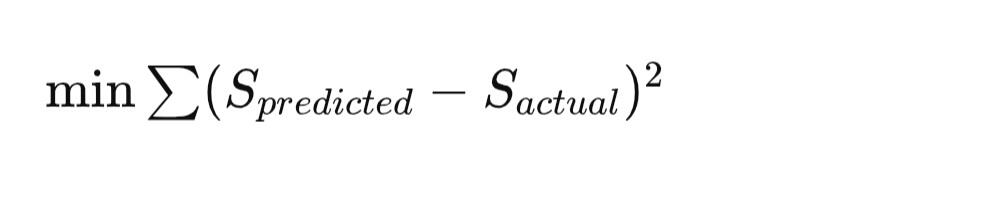
Optimal weights found by minimizing error.
Conclusion
This framework can be used in stock prediction. It could be helpful and be beneficial for stocks. Will you give it a try?


