
A data-driven look at whether higher publishing volume translates into stronger audience attention across selected crypto-native media outlets
Crypto media has always been fast. Markets move 24/7, narratives flip within hours, and newsrooms are constantly reacting to price swings, regulatory updates, hacks, ETF headlines, protocol launches, and founder posts.
But in 2026, the speed problem feels different.
It is no longer only whether crypto media can keep up with the market. It is whether readers can keep up with crypto media.
AI is part of this story, but not in the simplistic way the headline might suggest. This article does not claim to identify AI-generated articles. And it does not prove that AI directly caused lower traffic or weaker engagement.
Instead, it asks a more structural question.
If AI is making content production faster, cheaper, and easier to scale, what does that mean for reader attention?
Methodology and limitations
To explore that, we combined two inputs: anonymous 2026 survey responses from crypto media professionals about AI adoption, and a traffic-adjusted analysis of publishing volume across selected crypto-native media outlets. The analysis combines April 2026 traffic and engagement data from Outset Media Index (OMI) with a directional proxy of publishing-frequency estimates collected from public archives, RSS feeds, sitemaps, all-articles pages, and recent completed-day manual counts.
The core metric is:
Traffic-adjusted visits/article/day = April 2026 traffic / 30 / estimated articles per day
AI is making the volume question harder to ignore
In anonymous survey responses from crypto media professionals, AI was not described as a distant experiment. It was already part of newsroom workflows.
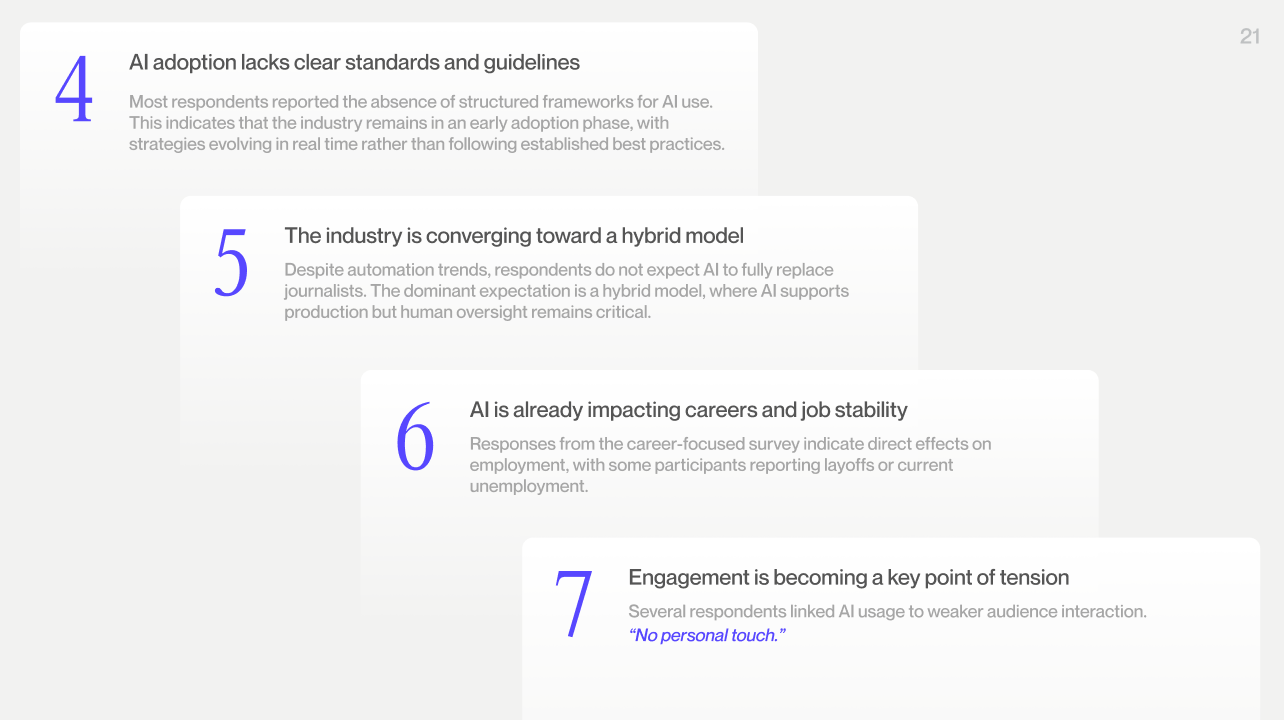
In the media-side survey, 70% respondents said their organizations were already using AI either partially or extensively in content production, while another 20% said they were in a testing phase.
The most common use cases included news writing, research, editing, SEO optimization, translation, and content ideation. The main reasons for adopting AI were speed and cost reduction. Most respondents also expected their organization’s AI usage to increase over the next 12 months.
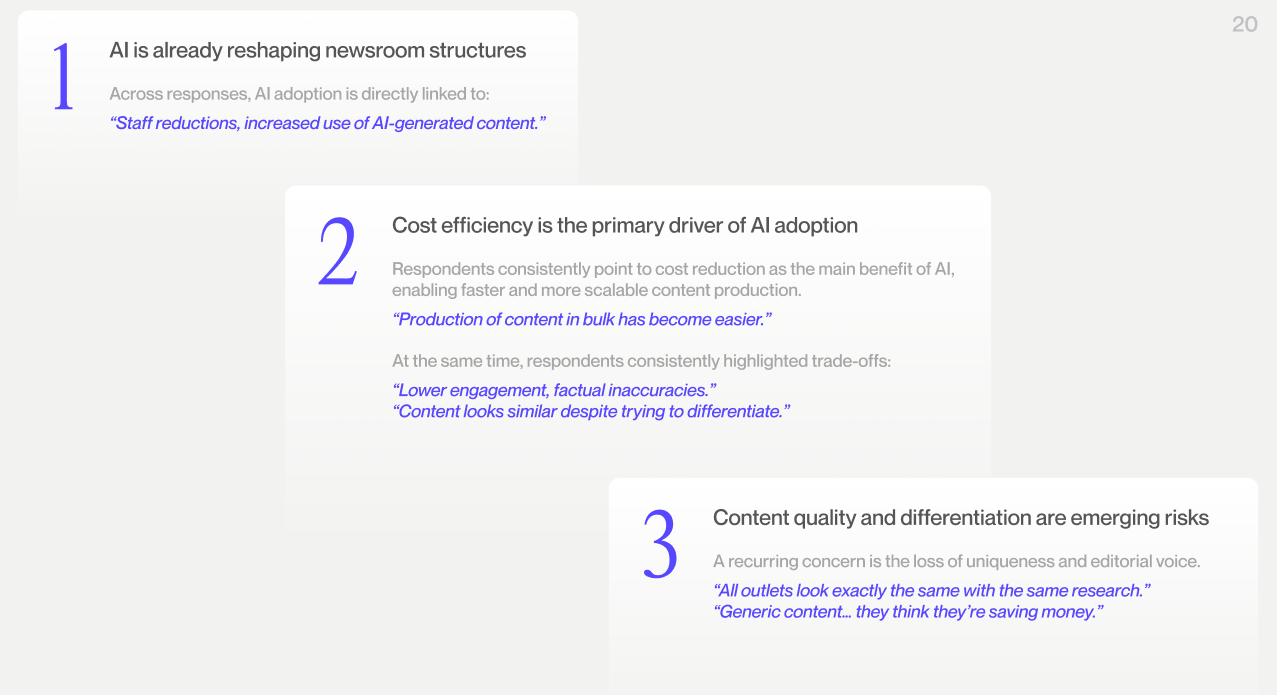
The staffing signals were just as important. Half of the media-side respondents said AI had reduced the number of writers in their organizations, while others described a shift from writers toward editors managing AI-assisted output.
A separate anonymous survey of people who had left or changed roles in crypto media showed the same tension from the labor side. Respondents described staff reductions, increased use of AI-generated content, and newsroom models where writers were replaced or supplemented by editors managing AI output. Several also raised concerns about quality, repetitive tone, factual inaccuracies, and the lack of clear AI usage guidelines.
The strongest recurring theme was not that AI automatically improves journalism. It was that AI makes bulk production easier.
That is why the volume question matters.
If media teams can publish more quickly and cheaply, the next question is not only whether more articles can be produced. It is whether those articles can still attract meaningful attention.
Raw traffic does not show how much attention each article receives
Raw traffic can be misleading.
A site with two million monthly visits and 20 articles per day is not operating in the same attention environment as a site with two million monthly visits and 170 articles per day.
In the second case, the same audience pool is spread across far more content.
For this analysis, we focused on 10 high-visibility crypto-native outlets selected from OMI’s earlier Q1 2026 media landscape research.
In that dataset, they formed the top 10 group within the tracked crypto-native media sample. Here, we use them not as a complete ranking of the global crypto media market, but as a focused sample to examine how publishing volume affects estimated attention per article.
To account for differences in publishing frequency, we used a simple output-adjusted proxy:
April 2026 traffic / 30 / estimated articles per day = traffic-adjusted visits per article per day
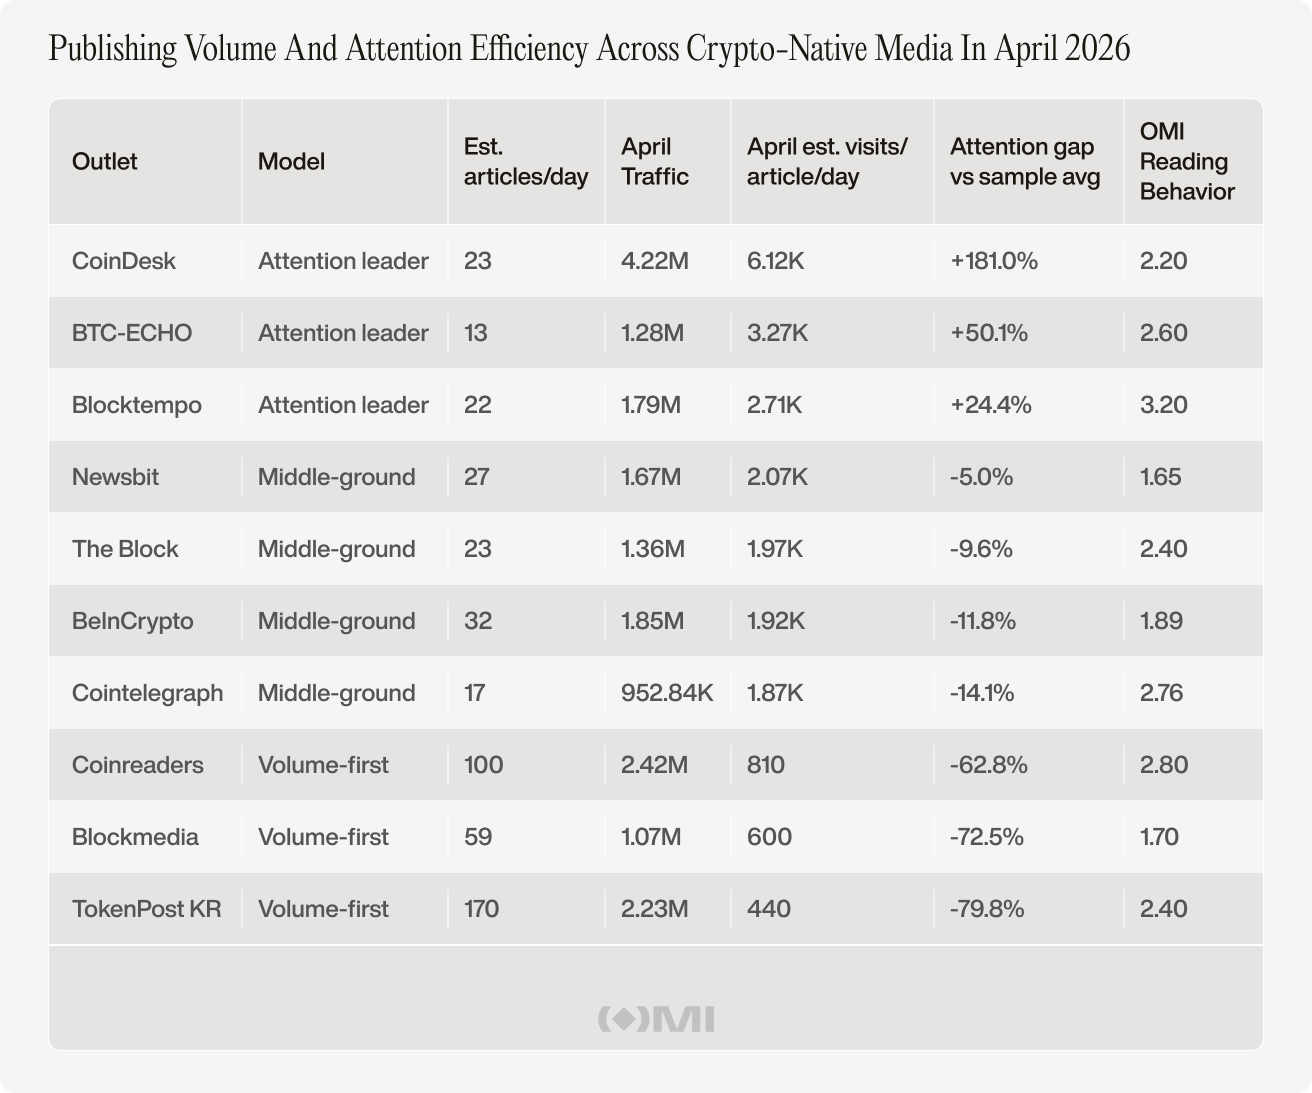
The sample average was 2.18K traffic-adjusted visits per article per day.
Against that benchmark, the differences were substantial.
The strongest attention-per-article outlets were not the highest-output publishers
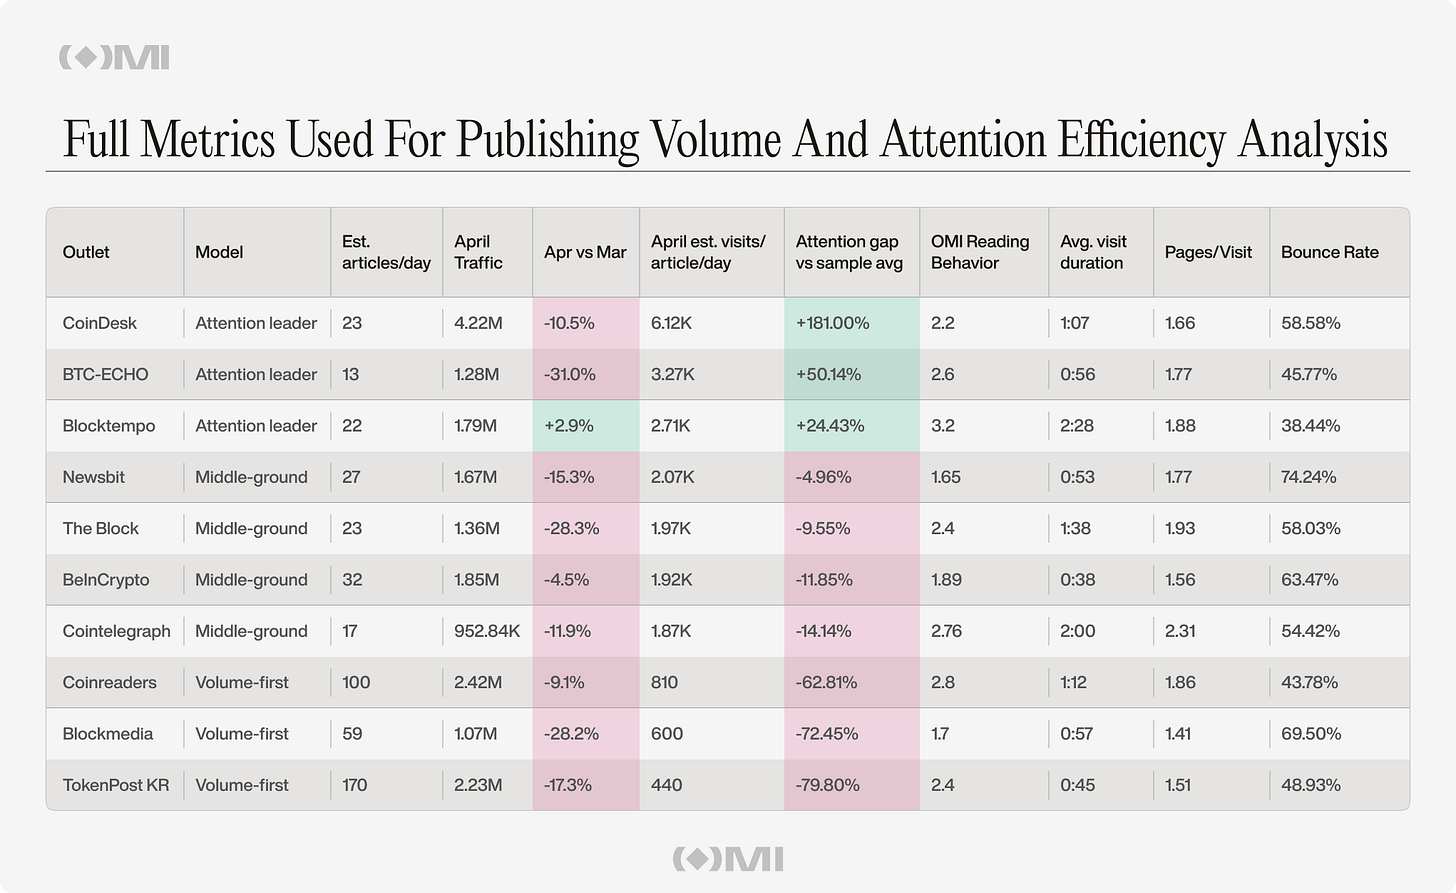
The strongest attention-per-article profiles belonged to CoinDesk, BTC-ECHO, and Blocktempo.
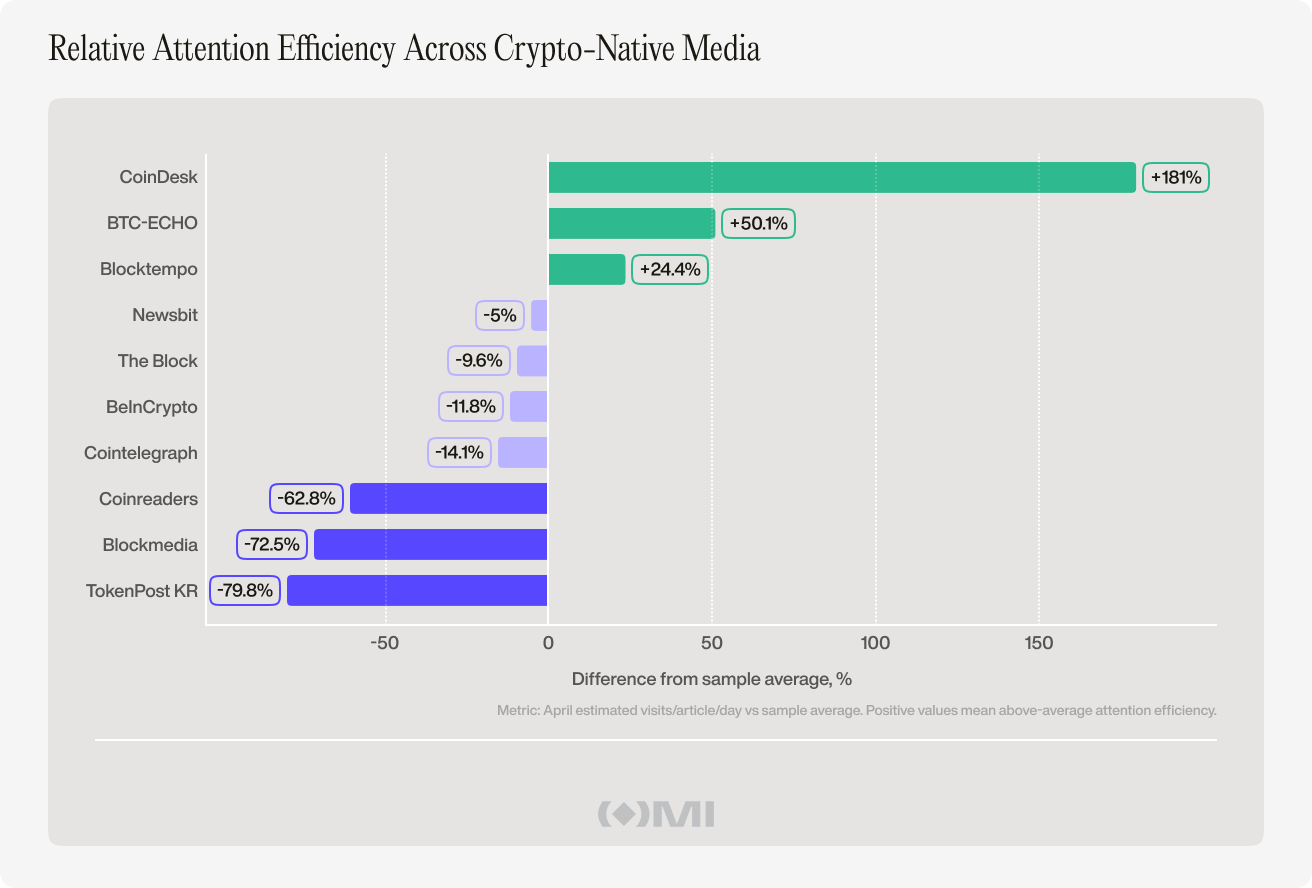
CoinDesk generated 6.12K traffic-adjusted visits per article per day, or +181% above the sample average. BTC-ECHO reached 3.27K, or +50.1%, while Blocktempo reached 2.71K, or +24.4%.
None of these outlets had the highest publishing volume in the sample.
That is the important part.
Their advantage was not simply that they had traffic. It was that their traffic was less diluted across extremely high article output.
By contrast, the highest-output outlets — TokenPost KR, Coinreaders, and Blockmedia — all sat far below the sample average for traffic-adjusted visits per article per day.
This does not mean those outlets have no audience value. Some still have meaningful traffic scale and reasonable site-level engagement indicators. But the output-adjusted view shows a different story:
Very high publishing volume can dilute the amount of attention available to each individual article.
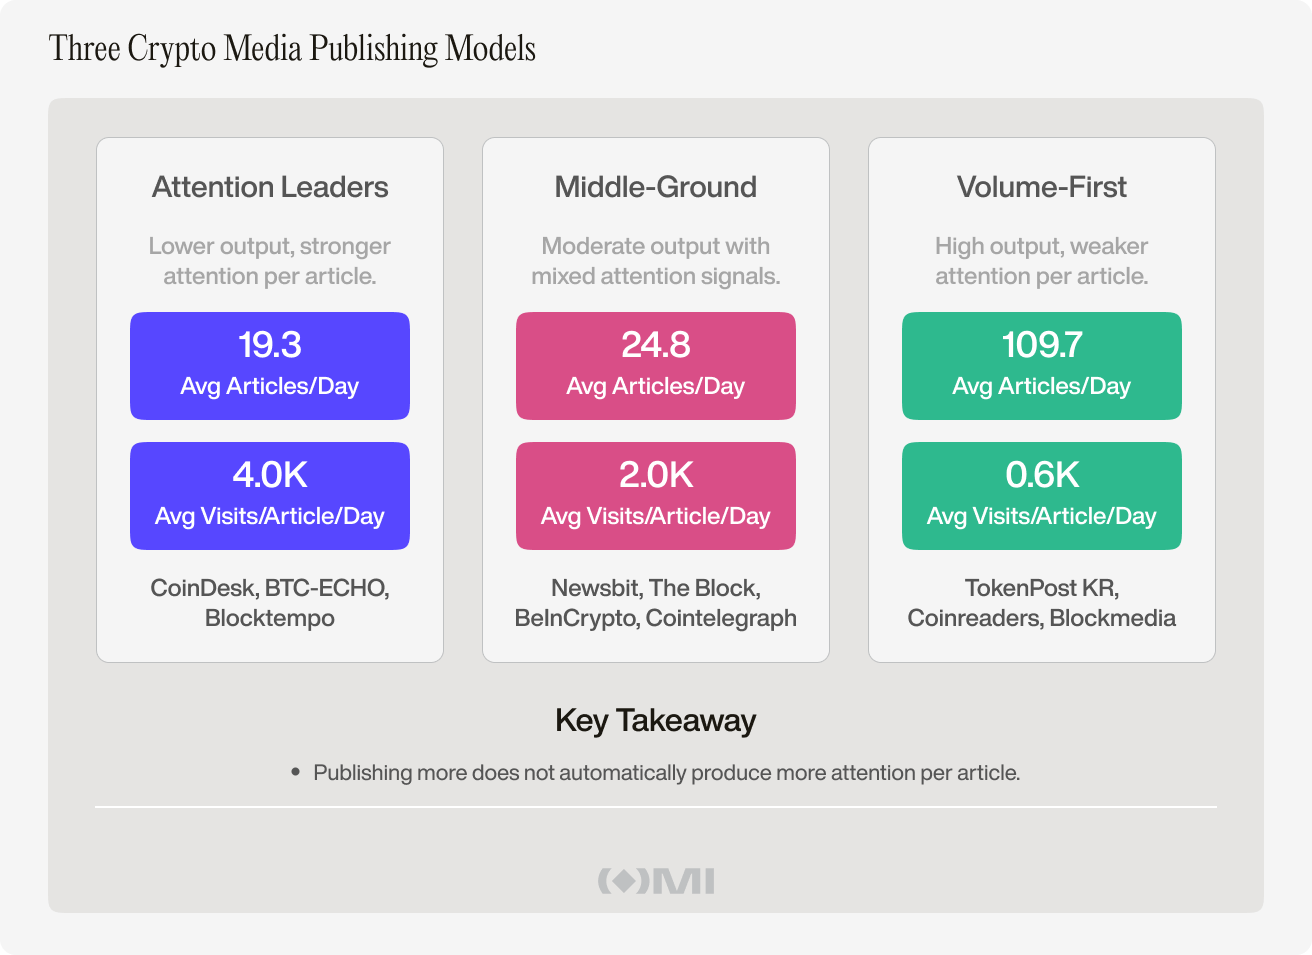
Crypto-native media are splitting into three publishing models
The sample splits into three broad publishing models: attention leaders, middle-ground publishers, and volume-first publishers.
These models describe different trade-offs between output, traffic, and estimated attention per article.
Some outlets appear to concentrate attention more effectively. Others publish more aggressively and likely serve search demand, regional updates, aggregation needs, and fast-moving news cycles.
The question here is not whether one model is always better. It is whether high output still creates proportionally high attention.
In this sample, it did not.
Attention leaders publish actively, but avoid extreme volume
The attention-leader group includes CoinDesk, BTC-ECHO, and Blocktempo.
These outlets publish actively, but not at extreme volume. Across the sample, they averaged 19.3 articles per day and 4.0K traffic-adjusted visits per article per day.
Their advantage is attention concentration.
They still operate in the fast-moving crypto news environment, but their estimated traffic per published item is significantly stronger than the rest of the sample.
This suggests that publishing frequency alone is not the main driver of article-level attention. Brand strength, editorial positioning, audience habits, distribution, and perceived quality likely matter more than raw output.
Middle-ground publishers sit close to the sample average
The middle-ground group includes Newsbit, The Block, BeInCrypto, and Cointelegraph.
They averaged 24.8 articles per day and 2.0K traffic-adjusted visits per article per day.
These outlets sit close to the sample average. Their models vary: some have strong brand recognition, some operate across localized editions, and some publish a broader mix of news, analysis, market updates, and evergreen content.
They do not show the same attention concentration as CoinDesk, BTC-ECHO, or Blocktempo. But they also do not show the same degree of attention dilution as the highest-volume publishers.
This is the center of the market: active, recognizable, but operating in a more competitive attention environment.
Volume-first publishers scale output, but dilute attention per article
The volume-first group includes TokenPost KR, Coinreaders, and Blockmedia.
They averaged 109.7 articles per day and only 600 traffic-adjusted visits per article per day.
This is the sharpest contrast in the analysis.
These outlets produce far more content than the other groups, but their estimated attention per article is much lower.
That does not necessarily mean the model is failing. High-volume publishing can still serve search demand, local market updates, breaking-news cycles, aggregation strategies, and regional information needs.
But it does show a trade-off: scale in article output does not automatically translate into scale in attention per article.
In an AI-assisted media environment, that trade-off becomes more important. If production becomes easier to scale, volume itself becomes less of a competitive advantage.
The TokenPost KR case: high output, low attention efficiency
TokenPost KR is the clearest high-output case in the sample.
In the data, it had:
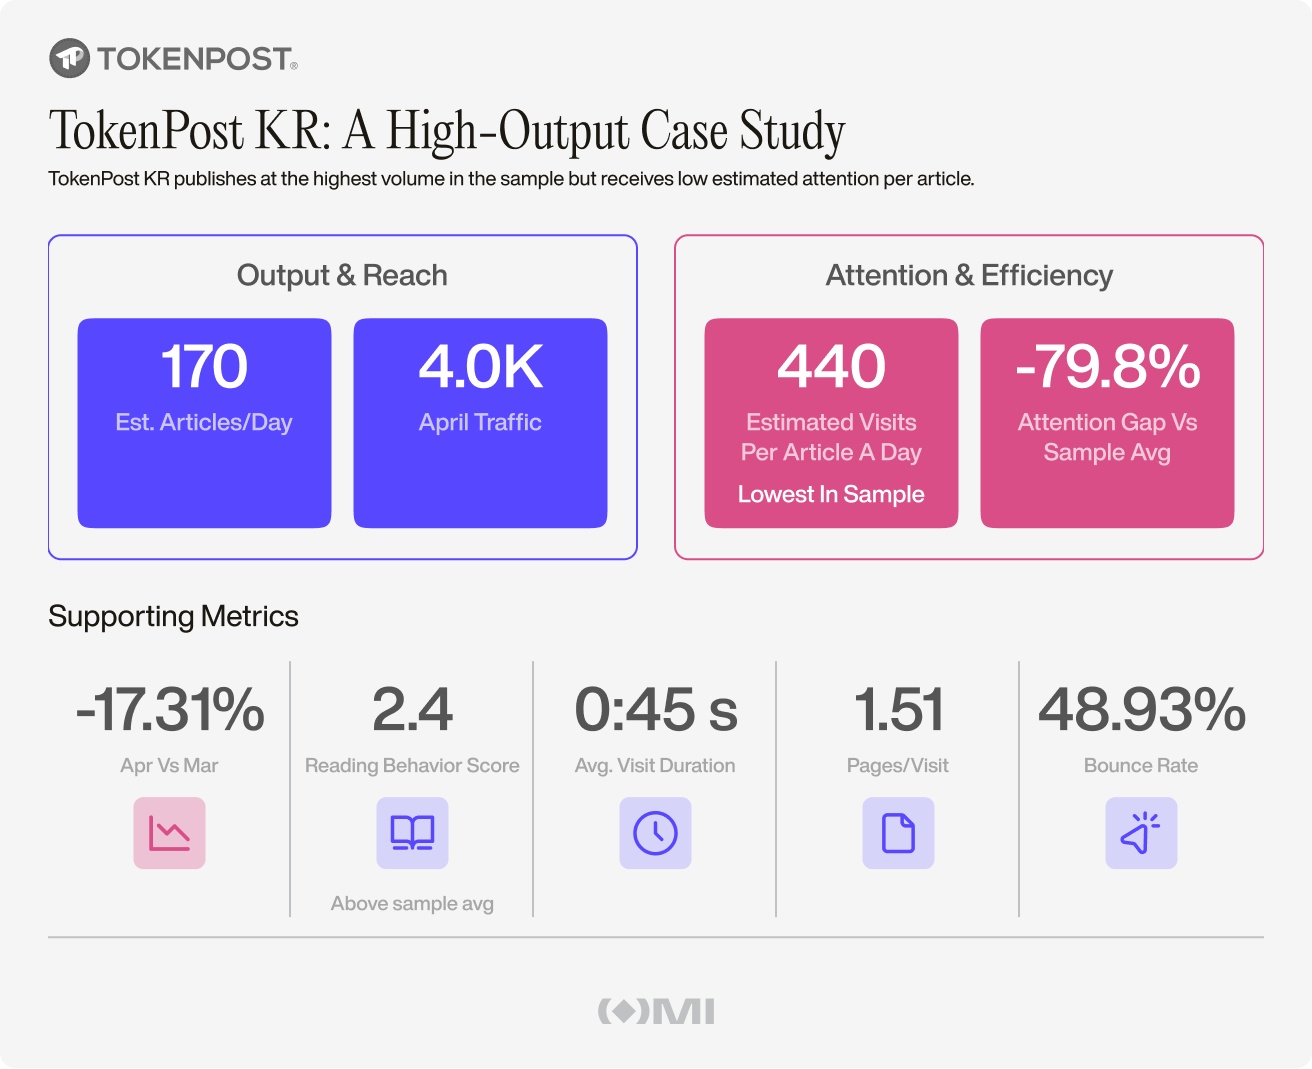
The key point is that TokenPost KR does not look irrelevant. It has meaningful traffic scale and a concentrated Korean audience. Its site-level engagement metrics are not uniformly weak compared with the rest of the sample.
But because its publishing volume is extremely high, its output-adjusted attention proxy falls to the lowest level in the group.
That makes TokenPost KR a useful case study for the broader issue: the volume-first model can preserve visibility and scale, but it may dilute attention at the article level.
AI did not create the attention problem — it may be exposing it
Crypto media was crowded long before the current AI wave.
The industry has always rewarded speed, quantity, and constant coverage. There were already incentives to publish more headlines, cover more tokens, chase more search demand, and react faster than competitors.
AI did not create those incentives.
But AI may be making them easier to act on.
When production becomes cheaper and faster, publishing volume becomes less of a constraint. A newsroom can produce more summaries, more rewrites, more translations, more SEO-led explainers, and more rapid updates. Smaller teams can cover more topics. Editors can manage AI-assisted output instead of relying entirely on traditional reporting workflows.
But reader attention does not expand in the same way.
There are still only so many hours in the day. There is still only so much trust a reader gives to repetitive coverage. There is still only so much attention available for dozens or hundreds of similar headlines.
That is the real bottleneck.
The survey responses suggest that AI is increasingly used to scale content production. The traffic data suggests that higher output does not automatically create stronger attention per article.
Together, they point to the same conclusion: the next phase of crypto media competition may not be about who can publish the most. It may be about who can still make each article matter.
Strong site engagement does not always mean strong attention per article
One important nuance: traffic-adjusted visits per article and OMI Reading Behavior measure different things.
OMI Reading Behavior is a site-level engagement metric. It helps describe how users behave once they arrive on a site.
Traffic-adjusted visits per article asks how much traffic is available per published item after accounting for publishing volume?
That is why a site can have a relatively solid Reading Behavior score but still show weak attention efficiency.
For example, Coinreaders has an OMI Reading Behavior score of 2.8, which is strong within the sample. But because it publishes an estimated 100 articles per day, its traffic-adjusted visits per article per day falls to 810, or 62.8% below the sample average.
That is not a contradiction. It shows that site-level engagement and output-adjusted attention are not the same thing.
A reader may behave reasonably well once they land on a site. But if the site publishes too many articles relative to its audience base, each individual piece still competes for a smaller share of total attention.
PR teams should stop looking at monthly traffic alone
For PR teams, the lesson is simple: monthly traffic is not enough.
A high-traffic outlet with extremely high publishing volume may not offer the same attention opportunity as a smaller or more selective outlet. If two sites have similar traffic, but one publishes five times as many articles, the attention available to each individual story is likely very different.
This matters for campaign planning.
A placement in a volume-first outlet may still be useful for visibility, search coverage, local market presence, or credibility within a specific region. But it should not automatically be treated as equal to a placement in an outlet where fewer stories compete for the same audience pool.
Traffic needs context.
Publishing frequency gives that context.
For media strategy, the same logic applies. If every newsroom can publish more, volume alone becomes a weaker differentiator. Editorial trust, original reporting, distinctive analysis, distribution quality, and audience loyalty become more important.
In an AI-assisted media environment, the strongest outlets may not be the ones producing the most content. They may be the ones that protect attention.
The real race is not volume, but attention
AI may be turning crypto media into a volume race, but that does not mean volume is the winning strategy.
The survey responses show why the pressure is rising: AI helps media teams move faster, reduce costs, and produce more. The traffic data shows the other side of the equation: more publishing does not necessarily mean more attention per article.
That is the core tension.
Crypto media can scale content production. But it cannot scale reader attention in the same way.
For publishers, this means the next competitive advantage may come from selectivity, originality, and editorial quality rather than endless output.
For PR teams, it means media value should not be judged by traffic alone.
And for the crypto media market as a whole, it suggests a bigger shift: the future may not belong to the outlets that publish the most.
It may belong to the outlets that make each article count.
Methodology appendix
How the sample was selected
The 10 outlets in this article were selected from OMI’s earlier Q1 2026 crypto-native media landscape research. In that dataset, they formed the top 10 group within the tracked crypto-native media sample.
This article uses them as a high-visibility sample for a follow-up analysis of publishing volume and attention efficiency. It should not be read as a complete ranking of the global crypto media market.
What data inputs were used
The analysis combines:
-
April 2026 OMI traffic and engagement data
-
Recent publishing-frequency estimates collected from public archives, RSS feeds, sitemaps, all-articles pages, and recent completed-day manual counts
-
Anonymous 2026 survey responses from crypto media professionals and people who have worked in or around crypto newsrooms
How traffic-adjusted visits per article were calculated
Traffic-adjusted visits/article/day = April 2026 traffic / 30 / estimated articles per day
This is a directional proxy. It is not actual article-level pageview data.
How the attention gap was calculated
Attention gap vs sample average = (Outlet traffic-adjusted visits/article/day / sample average - 1) × 100
The sample average was 2.18K traffic-adjusted visits per article per day.
Chart labels use shortened rounded values. The appendix table shows chart-aligned values to two decimal places.
How article output was estimated
Estimated articles/day was calculated separately from OMI traffic data.
Counts were based on the most reliable available source for each outlet, including official archives, RSS feeds, Google News sitemaps, all-articles pages, and recent completed-day manual counts.
Where identifiable, the following were excluded:
-
press releases
-
sponsored posts
-
advertorials
-
partner or guest promotional posts
-
ad blocks
-
duplicate titles
-
static category, tag, or author pages
How multi-domain outlets were treated
For brands represented by multiple domains in OMI, traffic and engagement metrics were treated at the consolidated brand level where relevant.
How survey responses were used
The survey responses are used to provide industry context around AI adoption in crypto media workflows.
They should not be interpreted as proof that specific outlets in the traffic sample are using AI, or that any specific article was AI-generated. The survey layer helps explain why the volume question is becoming more important, while the quantitative analysis focuses on publishing volume, traffic, and estimated attention efficiency.
Why engagement metrics are included as context
OMI Reading Behavior, Bounce Rate, Pages/Visit, and Avg. Visit Duration are site-level engagement metrics. They are included as context and should not be interpreted as article-level performance metrics.
P.S. The full analysis was published at OMI (Outset Media Index) Substack page.