
There's an old saying common among equity traders: Sell in May and go away.
That got me curious about what returns look like across the calendar for both BTC and ETH so I downloaded the daily data and went to work. Happy to share the results below for anyone that is interested. I double checked everything but that doesn't mean I'm above making an error so please do your own research to verify.
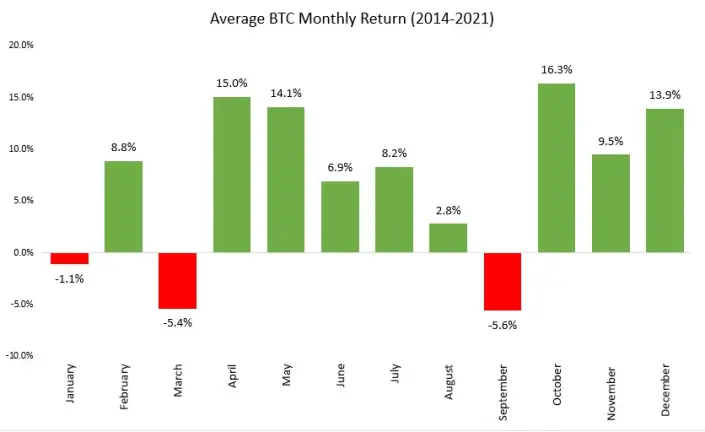
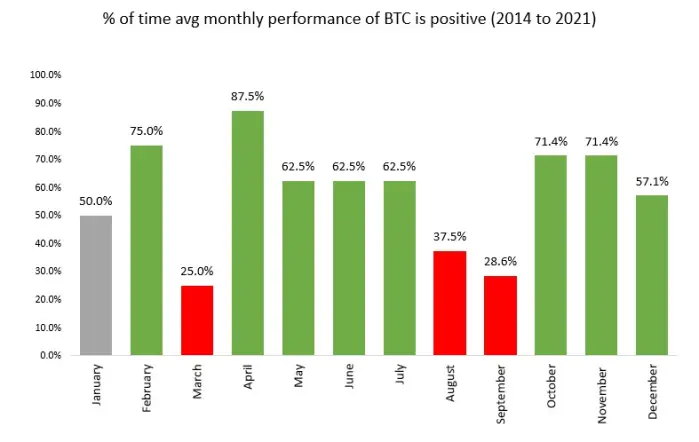
We'll take a look at Bitcoin first. I looked at both the average return for each month as well as the % of months that the return was positive. As you'll see in the graph below, using data since 2014, September is the worst month in terms of average returns. The good news is that October has been the best! The second graph shows that September also has a low hit rate with only 28.6% of the Septembers between 2014 and now (MTD) having positive returns.
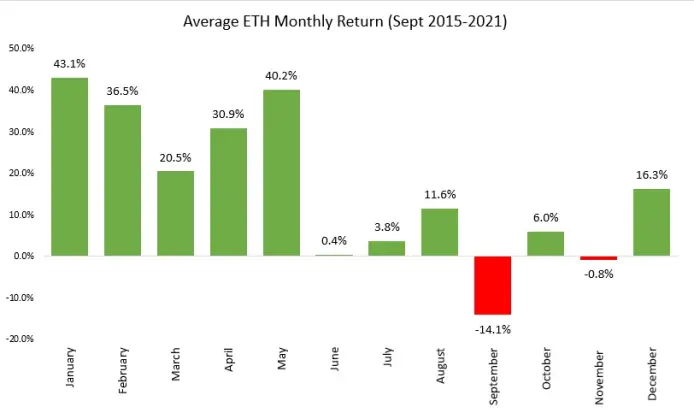
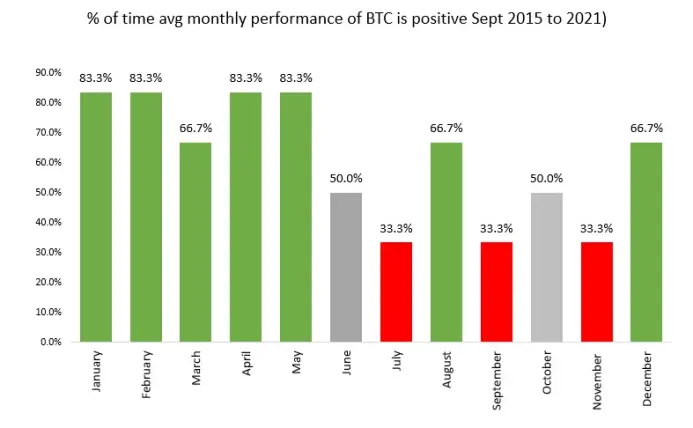
Turning our attention to Ethereum you'll see below that September is also the worst month for it in terms of average returns. In terms of the hit rate, only 1/3 of the Septembers between Sept 2015 and now have had positive returns.
Both of these data sets are pretty limited but I still thought this was interesting. Not sure if there are fundamental reasons why September is a bad month. Any ideas?
As always, this is not investment advice. Simply trying to share useful information to the community.
Cheers,
NZFX






