
Gold's price action today has traders paying close attention. The metal is currently changing hands at $4,376.16 per ounce, gaining 26.14 points, roughly a 0.60% move. This continues the bullish run that's been building since early August, when price broke past the first resistance zone sitting between $4,187 and $4,225. Once that area was cleared, gold kept grinding higher until it printed a fresh high at $4,449, landing right on an FVG zone that still hasn't been fully filled.
On the daily chart, three candles have now pushed through the gray FVG box located between $4,385 and $4,419. What stands out is that right after touching that peak, a bearish engulfing pattern formed. This tells us sellers stepped in, with a red body swallowing up the previous green candle. The broader structure still leans bullish, but this candle is flashing a warning that a short term pullback could be on the cards, even though the most recent candle actually closed green.
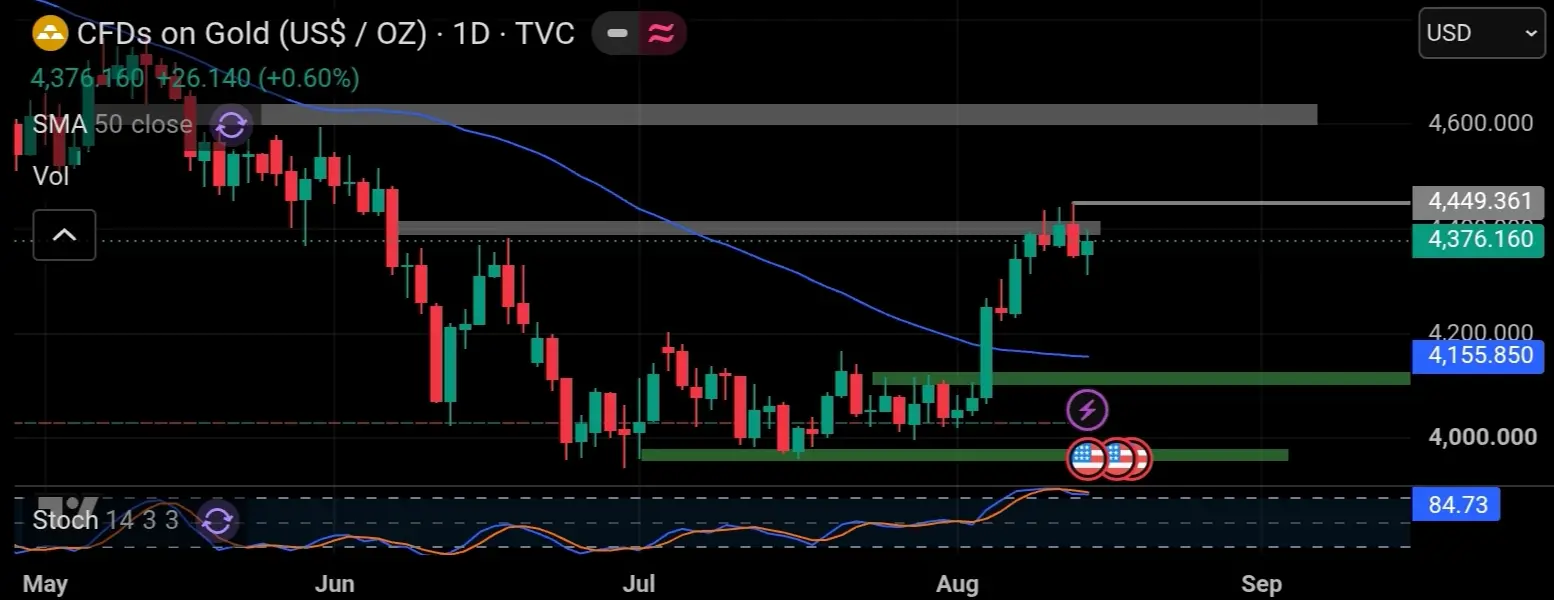
Zooming into the 4 hour chart, the picture gets a lot clearer. Price dipped briefly before carving out a change of character, hinting at a possible shift in momentum. As an analyst, I honestly can't say whether price will reject here first or just barrel straight through toward the next target zone at $4,595 - $4,642. All I can go off is what's playing out on the chart right now.
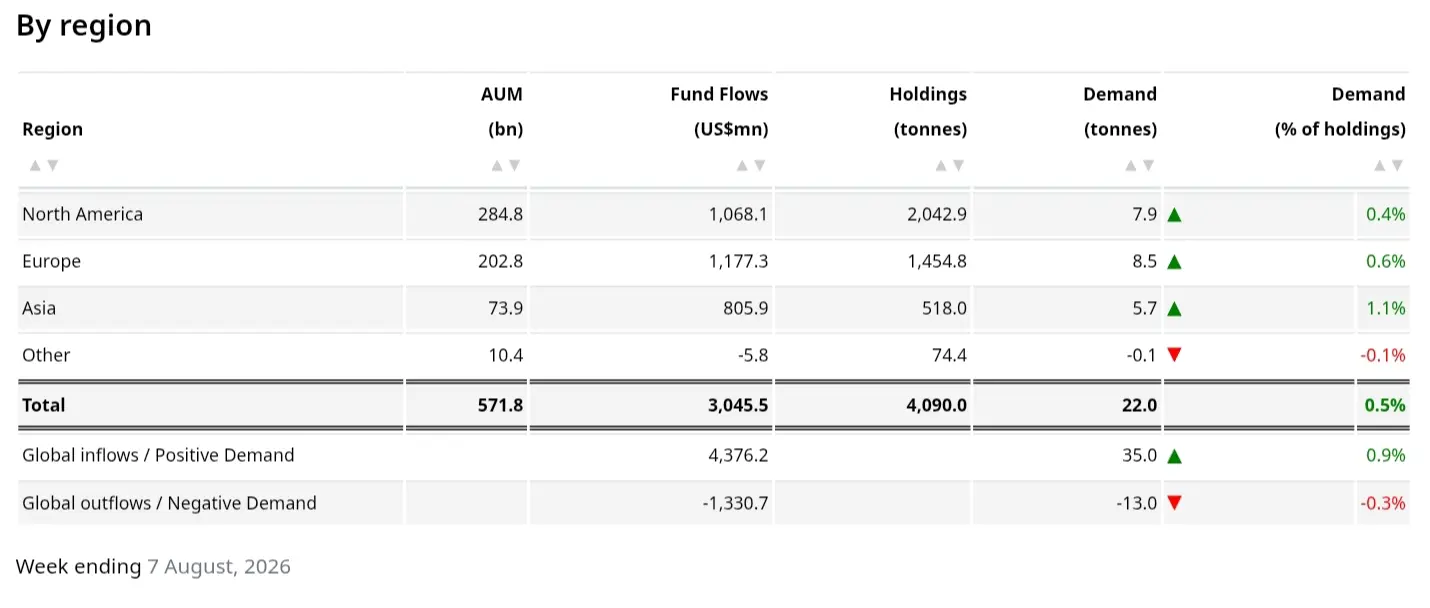
Adding another layer to this, the price action lines up neatly with global gold ETF flow data. For the week ending August 7, 2026, worldwide gold ETF holdings stood at 4,090 tonnes, with assets under management hitting $571.8 billion. Fresh capital of $3,045.5 million flowed in during that stretch, lifting demand by 22 tonnes, or 0.5% of total holdings. Broken down by region, North America, Europe, and Asia all posted solid positive inflows, while other regions saw a small dip of minus 0.1%.
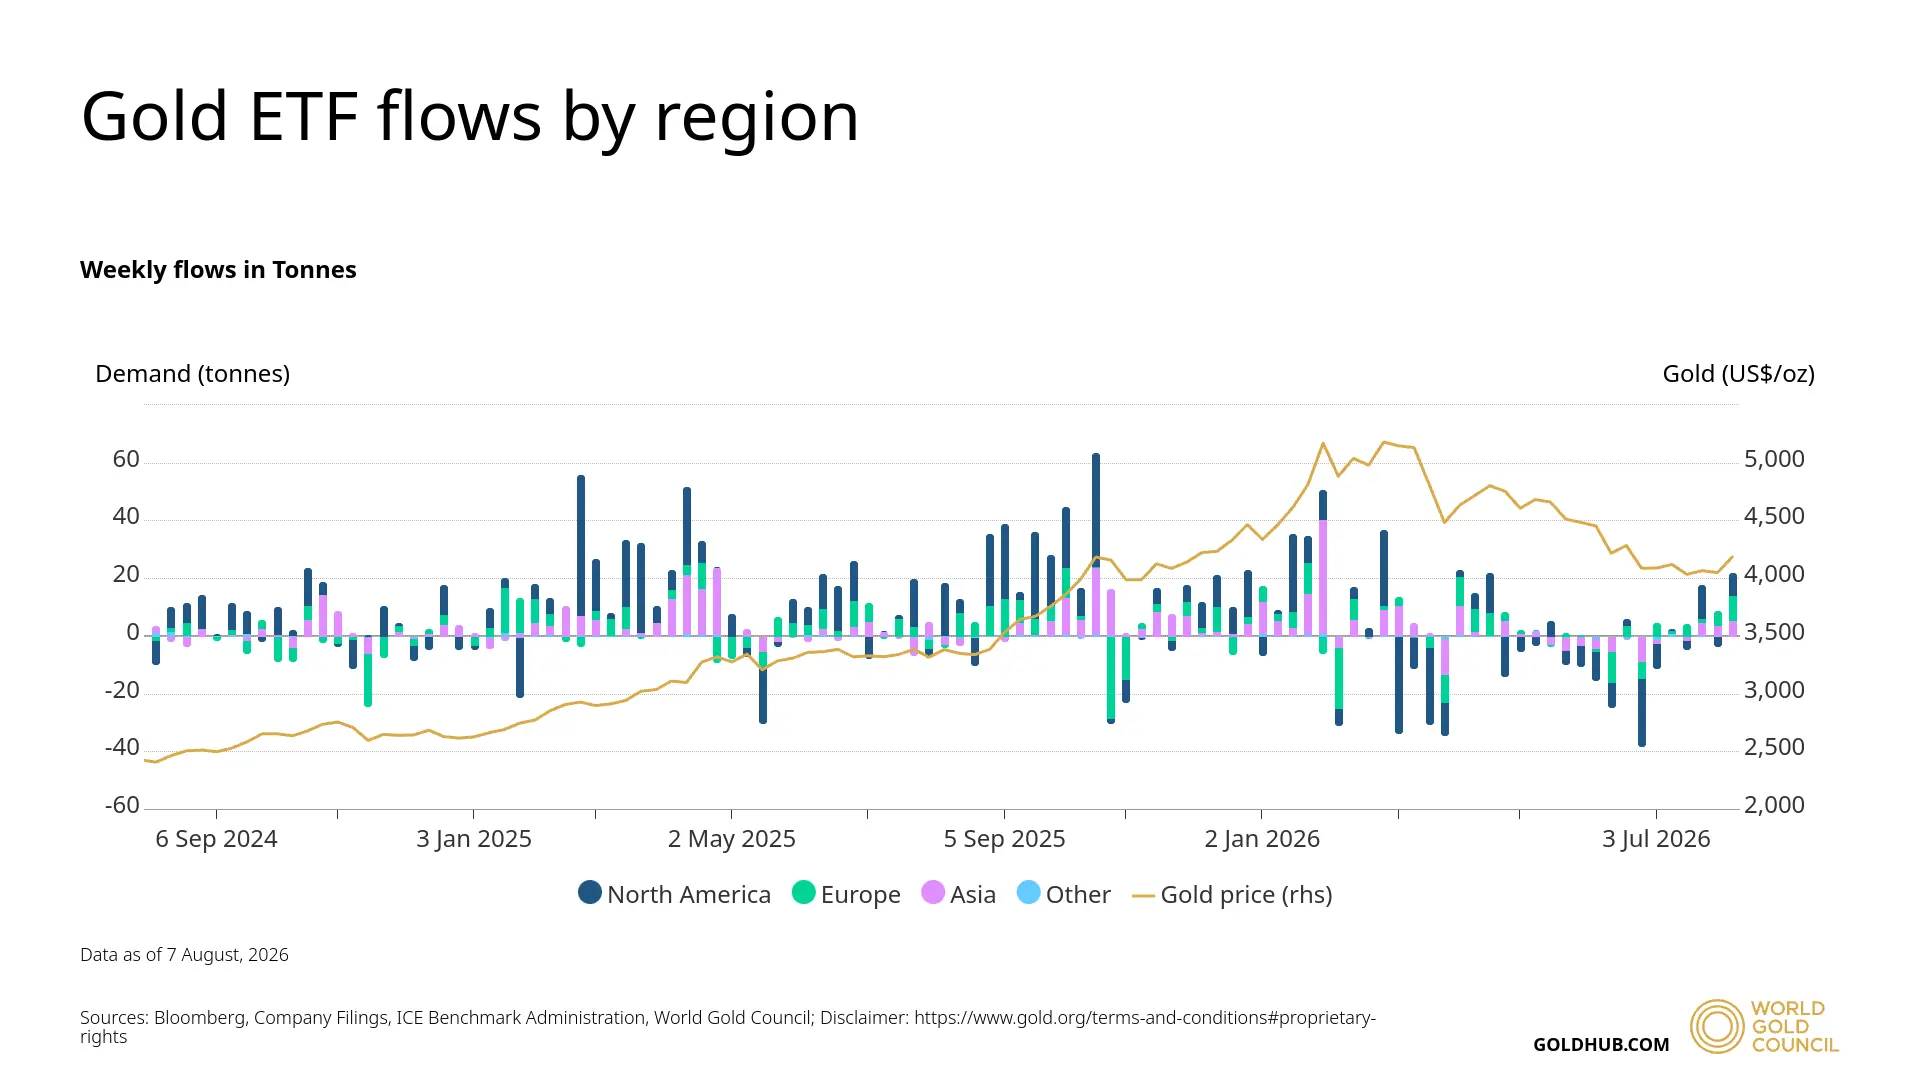
Historical ETF flow data going back to September 2024 tells a similar story, showing that big inflow surges tend to line up with gold's rally phases. That's exactly what happened right before price broke above $5,000 earlier this year, before eventually pulling back into the $4,000 - $3,900 range.
For anyone still holding long positions, it's worth staying alert to a possible short term pullback ahead. That said, the bigger picture still leaves plenty of room for the uptrend to keep going, as long as support at $4,155 continues to hold.
Click here to read my authentic and original analysis
⛔Disclaimer - This analysis is for educational purposes and reflects personal opinion only, not financial advice. Always practice risk management and use stop losses (SL) according to your own risk tolerance.





