
Investment Disclaimer:
- I am not a registered investment, legal, or tax adviser or a broker/dealer, and all opinions expressed by me are from my research for educational purposes only.
- Past performance presented here is not an indicator of future performance.
- This post expresses my own opinion about the cryptocurrency mentioned herein and is not an offer to buy or sell, or a solicitation of any offer to buy or sell the cryptocurrency mentioned in this post.
Announcement from Quantdoge
If you are actively following my blog- Daily Crypto Risk Report, I sincerely thank you for taking the time to read my analysis, and your support is greatly appreciated. To further improve the quality of my daily analysis, I am actively making constant enhancements here and there.
I am pleased to announce that Quantdoge would be adding the Community Analytics section which you could find below in this article, where this section would look at how the community of particular cryptocurrency fares over time, and their influence on the crypto prices over the last 100 days.
In the meanwhile, Quantdoge is working hard on Developer Analytics and On-Chain Analytics features which would be gradually released over this month. Please stay tuned.
1. Top 3 Good News for ETH HODLERS !!!
-
Ethereum (ETH) Tokens to Migrate to Cardano (ADA) Seamlessly: Ground-Breaking Concept Unveiled
Statistic as of 2021-05-18 23:20 AM EDT: 119 positive votes, 2 negative vote
With new instrument by Cardano (ADA) devs Input Output, ERC20 tokens become portable and can go live on Cardano smart contracts.
(Extracted from CryptoPanic) -
Ethereum to Reduce Energy Consumption by 99.95 Percent: Research
Statistic as of 2021-05-18 23:20 AM EDT: 60 positive votes, 5 negative votes
Ethereum to consume 99.95 less power after transitioning to proof of stake (PoS), according to researcher Carl Beekhuizen.
(Extracted from CryptoPanic) -
Ethereum Whales Refuse to Sell Despite ETH’s Plunge to $3,100
Statistic as of 2021-05-18 23:20 AM EDT: 51 positive votes, 4 negative votes
The enhanced market volatility in which ETH dropped to $3,100 has not urged Ethereum whales to dump their tokens.
(Extracted from CryptoPanic)
2. How Ethereum Performs Relative to Other Cryptos ?
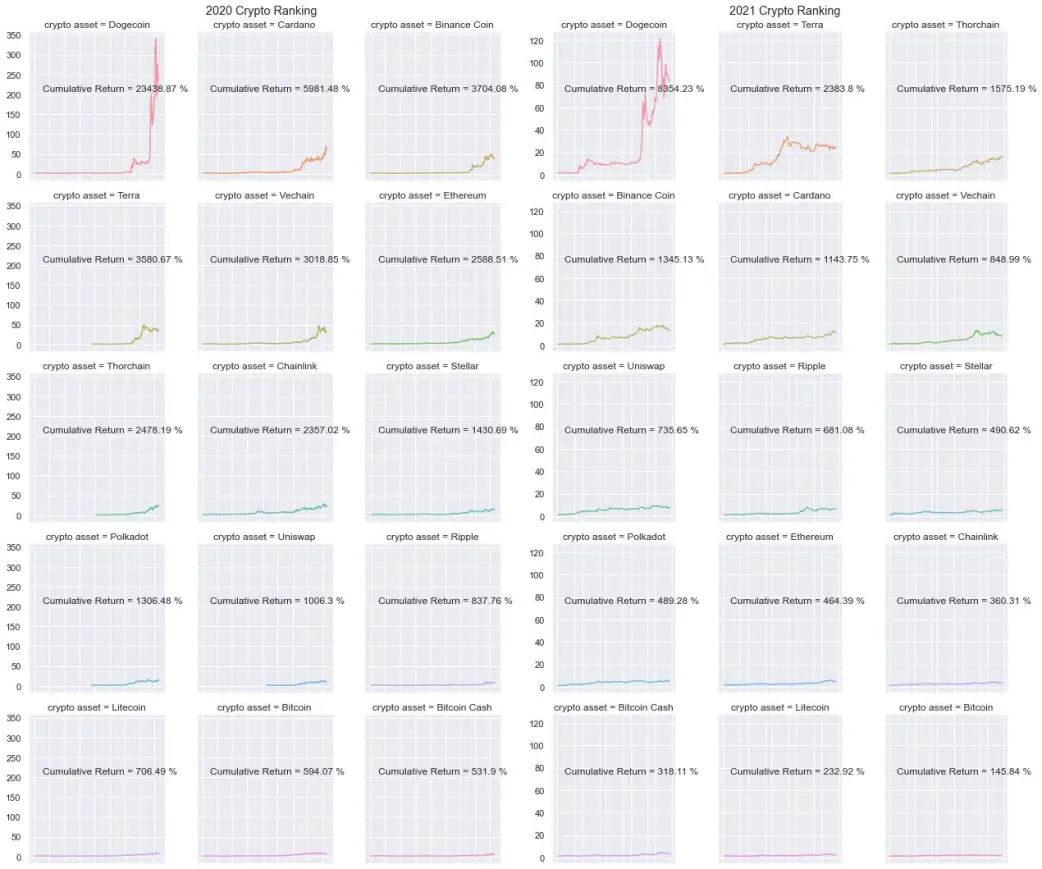
As of 19 May 2021, Ethereum has made a cumulative return of 2588.51% since Jan 2020 and 464.39% since Jan 2021. It is currently the 11th greatest performing crypto asset since Jan 2021 as compared to the other cryptocurrencies presented above.
3. Technical Analysis on Ethereum
3.1. Volume Weighted Average Price (VWAP)
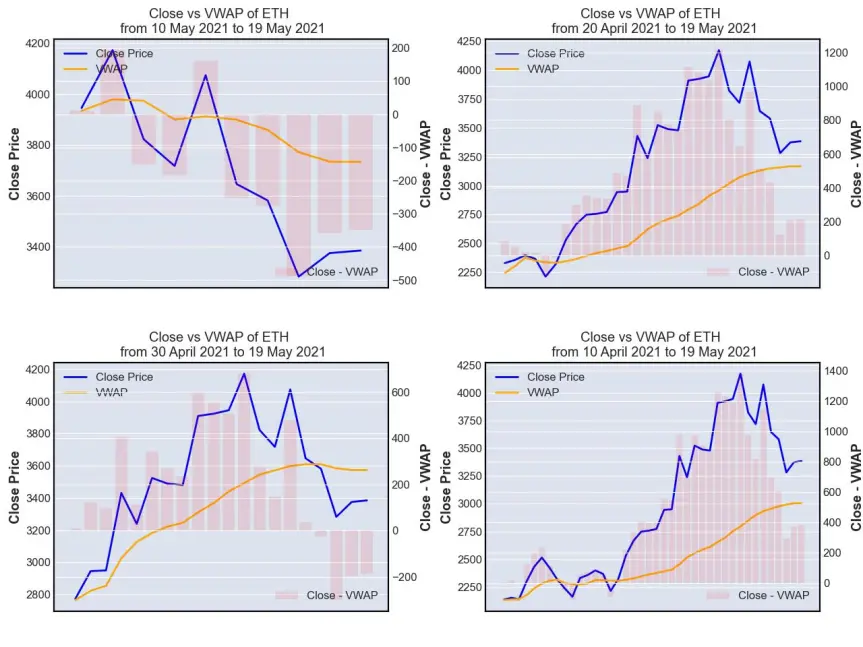
VWAP is a technical indicator used by a trader to gauge the overall trend of an asset price movement. VWAP line (orange line) represents the volume-weighted average price (average price here is defined as the average of high, low and close prices) while close price line (blue line) represents the price when ETH is closed at the end of every single day.
Whenever blue line (close price) is above orange line (VWAP), it indicates that the asset is gaining momentum and being traded higher than its average price level. This would represent a 'buy' opportunity for short-term momentum trader whom task is to trade following the trend while a longer term mean-revision trader might take it as a 'sell' opportunity, anticipating that the price of ETH (blue line) to fall to its average level (orange line).
Whenever blue line (close price) is below orange line (VWAP), it indicates that the asset is losing momentum and being traded lower than its average price level. This would represent a 'sell' opportunity for short-term momentum trader whom task is to trade following the trend while a longer term mean-revision trader might take it as a 'buy' opportunity, anticipating that the price of ETH (blue line) to rise to its average level (orange line).
As of 19 May 2021, VWAP is suggesting that ETH is trading far below its average price range of USD 3,600 to USD 3,800 per ETH.
3.2. Moving Average Convergence Divergence (MACD)
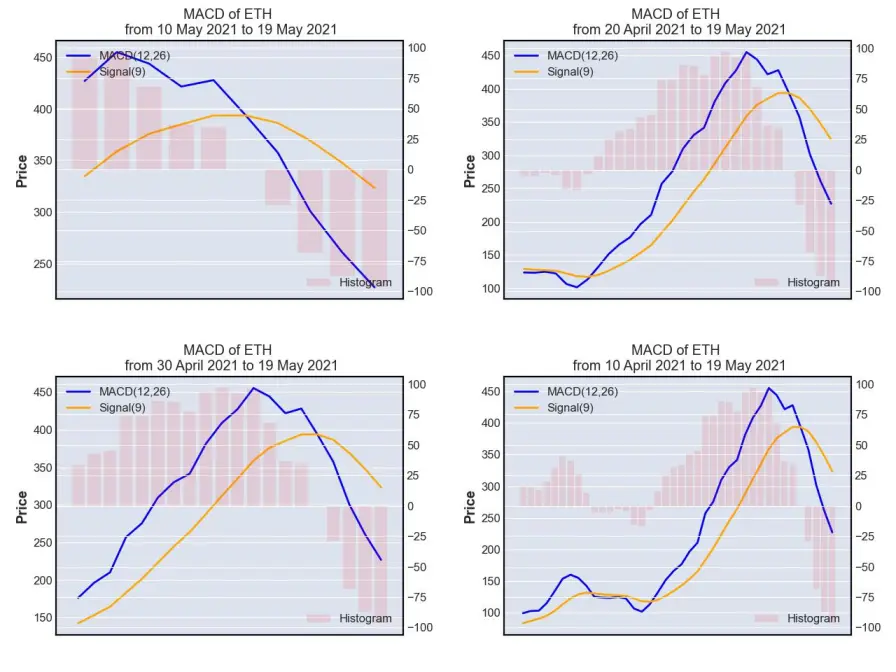
MACD is often used by trader as a momentum indicator. There are 2 lines that form the above charts, namely MACD (12, 26) lines and Signal(9) line, while the histogram is calculated by subtracting Signal (9) from MACD (12,26). Histogram would fall to the negative territory whenever MACD (12, 26) is trending at a lower level than Signal (9) and rise to the positive territory whenever MACD (12,26) is trending at a higher level than Signal (9).
MACD (12, 26) is computed by subtracting the 26-day exponential moving average (EMA) of ETH closing price from its 12-day EMA.
Signal (9) on the other hand is calculated as the 9-day EMA of MACD (12,26).
As MACD (12, 26) goes higher away from Signal (9), it signifies that ETH is gaining momentum and whenever it goes trends at a lower level than Signal (9),it signifies that ETH is losing momentum.
As of 19 May 2021, MACD is suggesting that ETH is losing momentum.
3.3. Bollinger Band
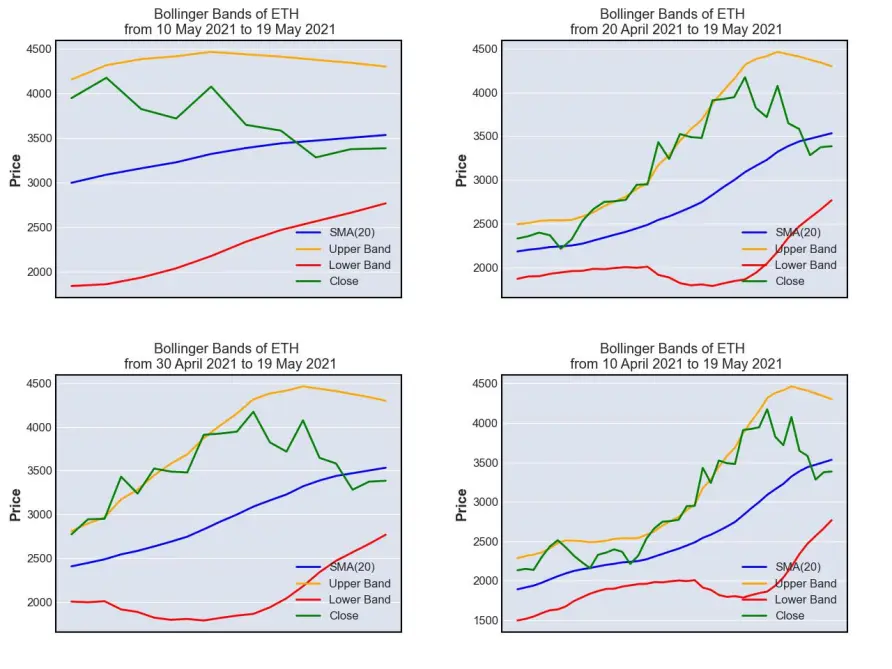
Bollinger band is often being used by mean-reversion trader as a gauge to assess how undervalued or overvalued an asset is. Its chart made up of 4 lines, namely:
- SMA (20) (blue line), which is the 20-day simple moving average price of ETH
- Upper Band (orange line), which is computed by adding 2 standard deviations of ETH on SMA (20)
- Lower Band (red line) , which is computed by subtracting 2 standard deviations of ETH from SMA (20)
- Close (green line), which is the daily closing price of ETH
Whenever close line (green) touches the lower band (red), it indicates that ETH is corrected too much and is being traded at an undervalued level, representing a 'buy' opportunity. On the other hand, whenever close line (green) touches the upper band (orange), it indicates that ETH is gaining too much momentum and is being traded at an overvalued level, thus indicating a 'sell' opportunity.
As of 19 May 2021, Bollinger Band is suggesting that ETH is trading at its fair value (i.e. neither overvalued nor undervalued).
3.4. Relative Strength Index (RSI)
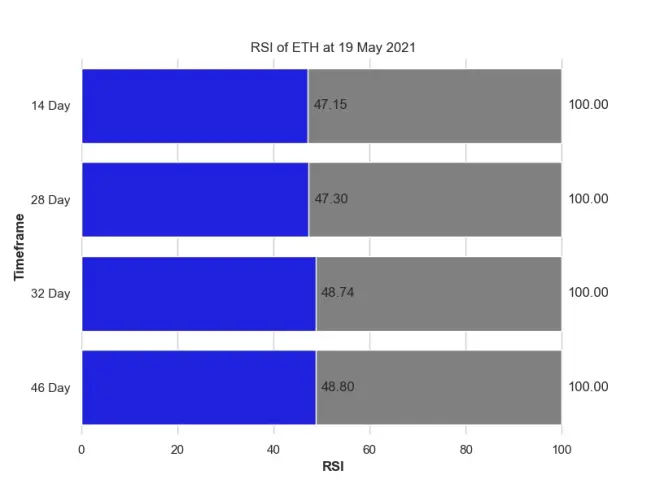
Just like Bollinger Band, Relative Strength Index is often being used by mean-reversion trader as a gauge to assess how undervalued or overvalued an asset is. There are 2 psychological levels, i.e. 30 and 70 in RSI. Whenever the RSI reaches 30, it indicates that ETH is corrected too much and is being traded at an undervalued level, representing a 'buy' opportunity. On the other hand, whenever RSI reaches 70, it indicates that ETH is gaining too much momentum and is being traded at an overvalued level, thus indicating a 'sell' opportunity.
As of 19 May 2021, RSI is suggesting that ETH is trading at its fair value (i.e. neither overvalued nor undervalued).
Based on the technical analysis presented above, quantdoge holds a neutral stance on the short-term price outlook of Ethereum, but I could be wrong, hence please make your careful due diligence before making any financial decision.
4. Ethereum Risk Profile
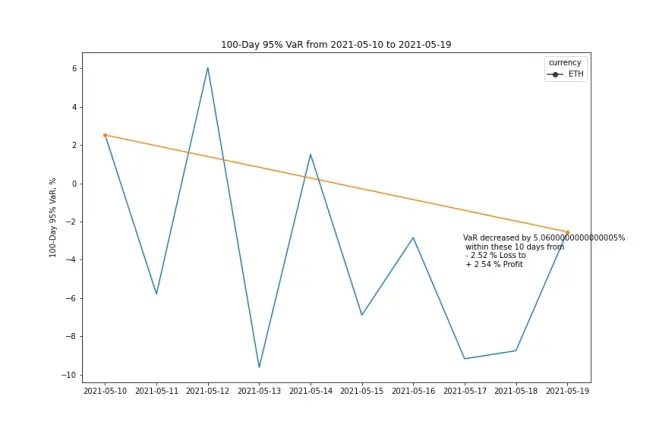
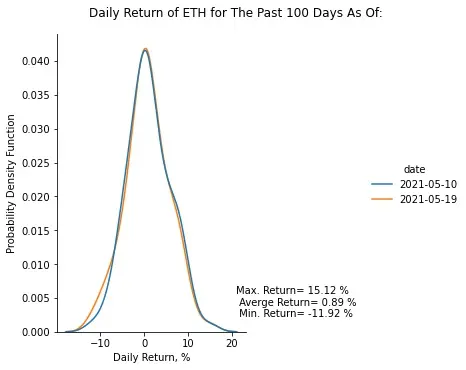
Based on the 100-day 95% historical Value-at-Risk (VaR) profile of Ethereum defined above, ETH seems to trade at a lower risk level on 19 May 2021 as compared to 10 days before on 09 May 2021, with its biggest pullback being seen at - 11.92% on a single day during the last 100 days. However, I could be wrong, hence please make your careful due diligence before making any financial decision.
5. Price Simulation for Ethereum
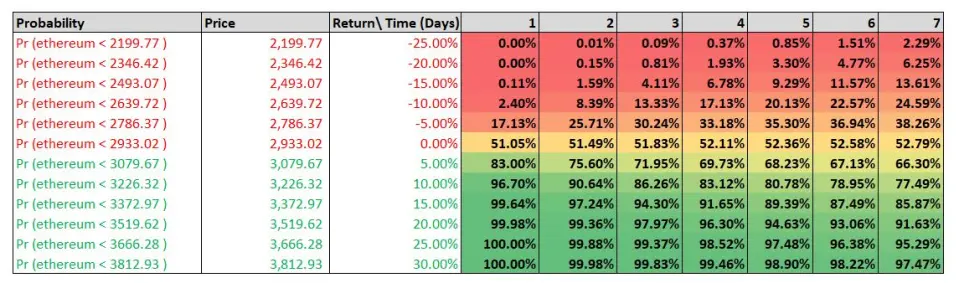
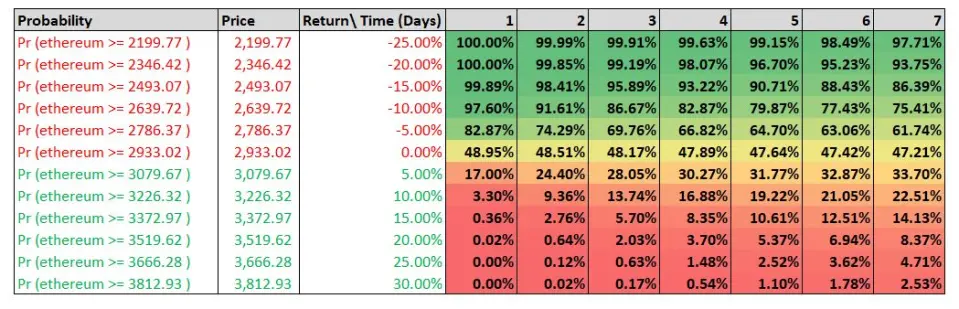

How did quantdoge simulation perform vs the actual ETH price movement over the last week ?
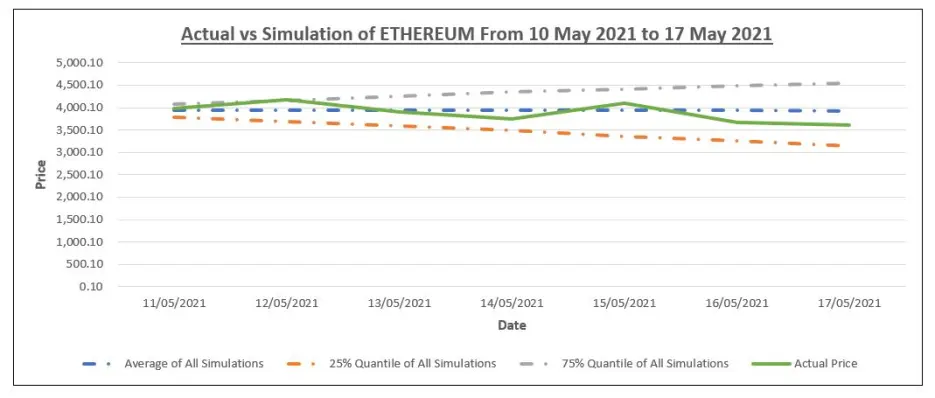
Over the last 7 days, ETH has been trading near the median price range of quantdoge simulations, indicating that ETH was trading at a fair value level over the last week.
6. ETH Community Analytics
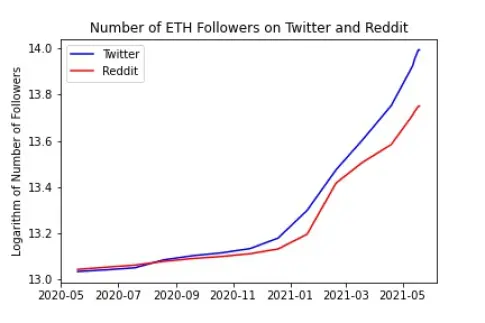
Ethereum has been gaining a lot of followers on both Twitter and Reddit in the past year.
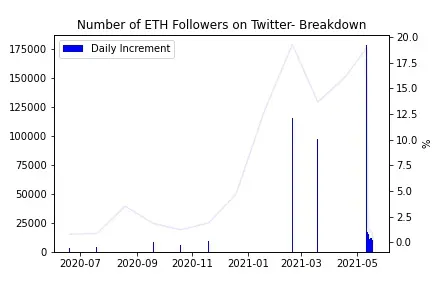
Ethereum has gained the most number of Twitter followers this month, as seen from the peak in 2021-05.
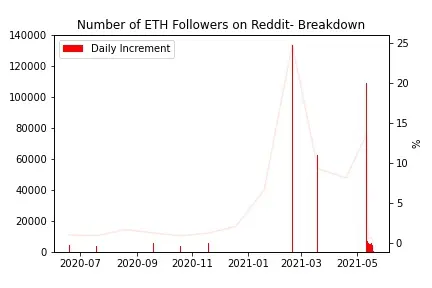
Ethereum has gained the greatest amount of Reddit followers in Feb 2021, although the monthly increment of Reddit followers have slowed down in March, the follower count has increased significantly in May.
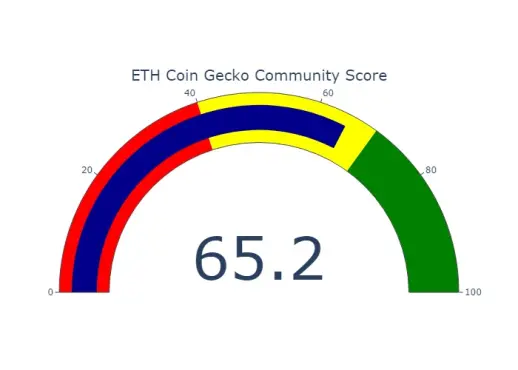
Overall, Ethereum has received a community score of 54.2% on Coin Gecko.
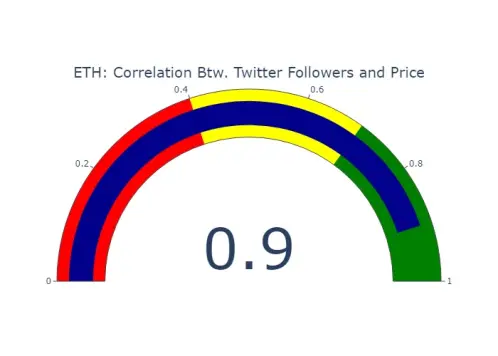
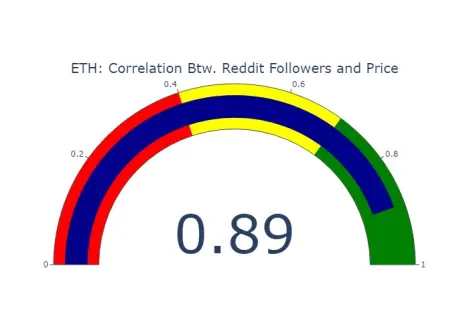
Based on the last 100 days data, there is a strong positive correlation between community support (measured by the increment in number of Reddit and Twitter followers) and Ethereum price.

Are you looking for a crypto wallet which offers you an easy way to securely store your crypto while giving you the ability to earn crypto? Look no further than Coinbase, the cryptocurrency exchange and custody which has just went public in NASDAQ last month. You would get around USD 10 worth of free bitcoin if you sign up with my referral link below:
https://www.coinbase.com/join/lim_2kx
Besides, you would also be able to earn free cryptocurrencies via Coinbase Earn program where you need to do is just complete a series of short lessons about different cryptos.
If you are into ChainLink (LINK) and Cardano (ADA), I have made similar analysis on them at:
- 17 May 2021 (MON)- ChainLink (LINK) Daily Risk Report
- 10 May 2021 (MON)- Cardano (ADA) Daily Risk Report
If you like my analysis and articles, please follow me at @quantdoge for daily updates.






