Investment Disclaimer:
- I am not a registered investment, legal, or tax adviser or a broker/dealer, and all opinions expressed by me are from my research for educational purposes only.
- Past performance presented here is not an indicator of future performance.
- This post expresses my own opinion about the cryptocurrency mentioned herein and is not an offer to buy or sell, or a solicitation of any offer to buy or sell the cryptocurrency mentioned in this post.
- I do hold a long position in DOT as a token holder.
1A. Polkadot Project Updates
1. Get BUIDLING With Polkadot at ETHDenver 2022 (29 Jan 2022)
Polkadot returns to ETHDenver this year for more creativity, code, and chaos. Meet the teams in person, join the $15k bounty, or check out the talks, presentations, and workshops online; February 11–20, 2022. All free!
The Polkadot ecosystem also has a great community that includes everyone from experienced devs to people who are just excited by the tech and how it can be used.
2. Introducing Encointer: Making Web3 Truly Inclusive (24 Jan 2022)
Encointer has created a framework that enables any geographically concentrated group of people to create, distribute and use their own digital community tokens. Such tokens can be distributed regularly to active participants at no cost, functioning akin to universal basic income. This could foster local economic activity in communities where individuals have skills and products to sell, but lack the money to trade them.
Furthermore, by providing a way to pay fees in a token adjusted to local purchasing power, it could act as a first stepping stone to greater adoption of Web3 services in developing countries and emerging markets. Creating a “unique identity system” or unique proof of personhood is regarded as one of the hard problems of decentralized systems by Vitalik Buterin. Although key signings take place in person, the protocol also involves numerous mechanisms to protect the privacy of users, which is highly important if you can only maintain a single unique identity.
1B. Top 3 Good News for DOT HODLERS !!!
- Polkadot, Cardano, Solana Forerun Bitcoin, Ethereum As Crypto Assets With Least Carbon Footprints
Statistic as of 2022-02-09 07:49 AM EDT: 25 positive votes, 0 negative vote
With the debate on the energy consumption of various crypto blockchains raging on, a new report now shows how various top blockchain networks relate in terms of power consumption. According to a recent report by Ulrich Gallersdörfer, Lena Klaaßen, and Christian Stoll of the Crypto Carbon Ratings Institute, Polkadot topped the list.
(Extracted from Crypto Panic) - Polkadot Allocates 993,286 DOT to Boost its Ecosystem and Web3 Development
Statistic as of 2022-02-09 07:49 AM EDT: 18 positive votes, 0 negative vote
Polkadot has allocated $21 million for ecosystem development as it emerges as the blockchain network with the smallest carbon footprint.
(Extracted from Crypto Panic) - Cardano, Polkadot, Bitcoin, and Dogecoin Poised For Huge Rebound – What To Expect In The Near Term
Statistic as of 2022-02-09 07:49 AM EDT: 16 positive votes, 3 negative votes
Markets are showing signs of recovering from last week’s lows. BTC, ADA, DOT, and DOGE started the week well. Discussions on the environmental impacts of mining this week may cause market reactions. Following last week’s slump, markets are beginning to look up again.
(Extracted from Crypto Panic)
2. How Polkadot Performs Relative to Other Cryptos ?
Performance of All Cryptos Under Quantdoge Watchlist since 2021 (Sorted by % Return)
DOT has undergone 139.52% return from USD 9.361 to USD 22.4212 since 01 Jan 2021. DOT is the 26th best performing crypto assets among others here.
3. How Resilience Polkadot Is Towards Bitcoin Crash Relative to Other Cryptos ?
Historically, all altcoins are somewhat dependent on Bitcoin price movement and it’s often the case where if Bitcoin falls, most altcoins would follow.
Top 3 Cryptos That Are Most Resilient To Bitcoin Crash During Each of BTC 4 Largest Crashes in 2021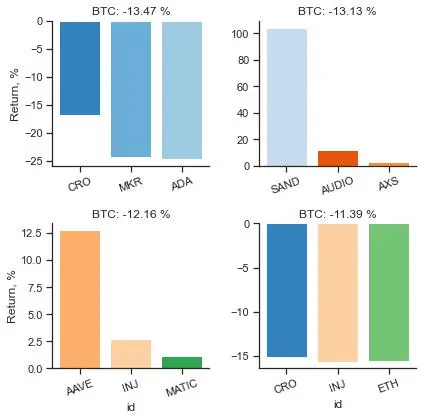
DOT has proven resilience against BTC crash in 0 out of the 4 instances.
During the last 4 BTC market crashes,
When BTC dropped by -13.47 %, DOT returned -37.36 % at 20 May 2021,
When BTC dropped by -13.13 %, DOT returned -10.95 % at 22 January 2021,
When BTC dropped by -12.16 %, DOT returned -8.45 % at 13 May 2021,
When BTC dropped by -11.39 %, DOT returned -23.93 % at 22 June 2021
4. Technical Analysis on Polkadot
4.1. Volume Weighted Average Price (VWAP)
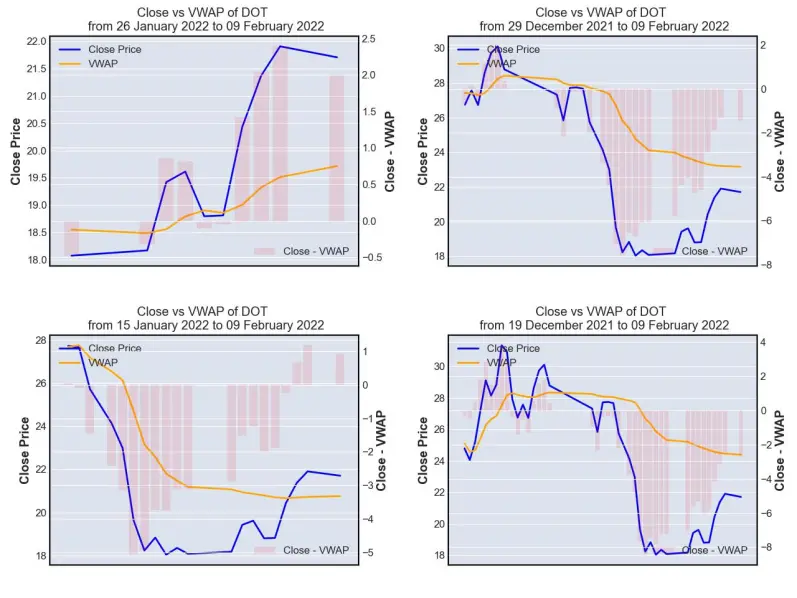
VWAP is a technical indicator used by a trader to gauge the overall trend of an asset price movement. VWAP line (orange line) represents the volume-weighted average price (average price here is defined as the average of high, low and close prices) while close price line (blue line) represents the price when DOT is closed at the end of every single day.
Whenever blue line (close price) is above orange line (VWAP), it indicates that the asset is gaining momentum and being traded higher than its average price level. This would represent a 'buy' opportunity for short-term momentum trader whom task is to trade following the trend while a longer term mean-revision trader might take it as a 'sell' opportunity, anticipating that the price of DOT (blue line) to fall to its average level (orange line).
Whenever blue line (close price) is below orange line (VWAP), it indicates that the asset is losing momentum and being traded lower than its average price level. This would represent a 'sell' opportunity for short-term momentum trader whom task is to trade following the trend while a longer term mean-revision trader might take it as a 'buy' opportunity, anticipating that the price of DOT (blue line) to rise to its average level (orange line).
As of 08 Feb 2022, VWAP is suggesting that DOT has been gaining a huge momentum these few days, although it is now trading way above its week-long volume-weighted average price, it is still trading its month-long volume-weighted average price.
4.2. Moving Average Convergence Divergence (MACD)
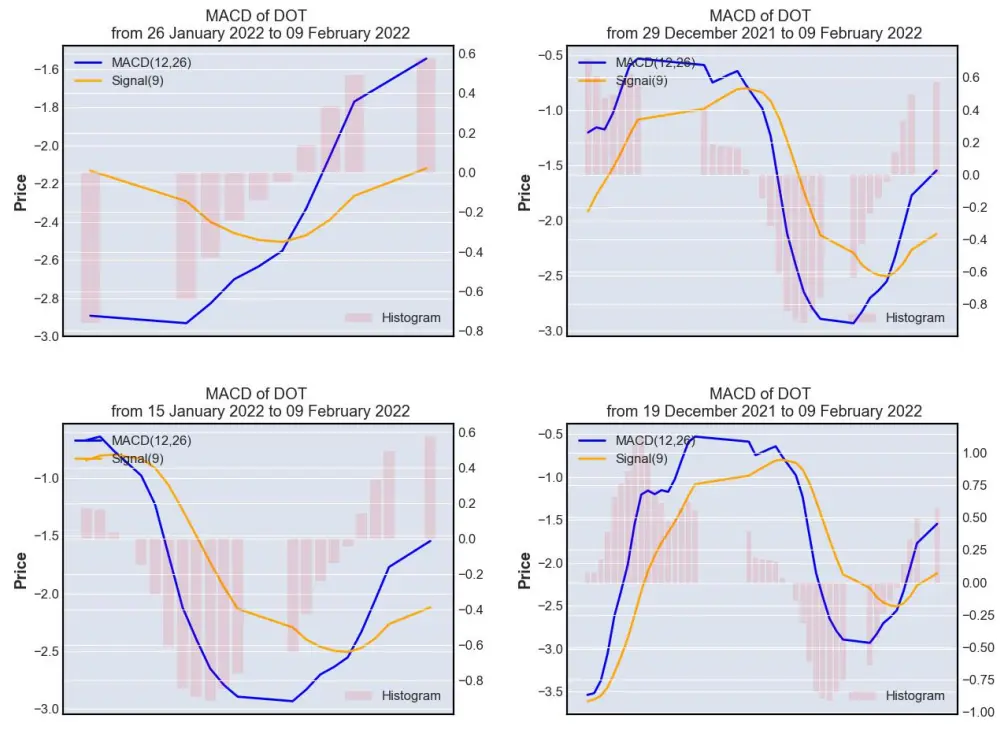
MACD is often used by trader as a momentum indicator. There are 2 lines that form the above charts, namely MACD (12, 26) lines and Signal(9) line, while the histogram is calculated by subtracting Signal (9) from MACD (12,26). Histogram would fall to the negative territory whenever MACD (12, 26) is trending at a lower level than Signal (9) and rise to the positive territory whenever MACD (12,26) is trending at a higher level than Signal (9).
MACD (12, 26) is computed by subtracting the 26-day exponential moving average (EMA) of DOT closing price from its 12-day EMA.
Signal (9) on the other hand is calculated as the 9-day EMA of MACD (12,26).
As MACD (12, 26) goes higher away from Signal (9), it signifies that DOT is gaining momentum and whenever it goes trends at a lower level than Signal (9),it signifies that DOT is losing momentum.
As of 08 Feb 2022, MACD is suggesting that DOT is in an upward momentum ride.
4.3. Bollinger Band
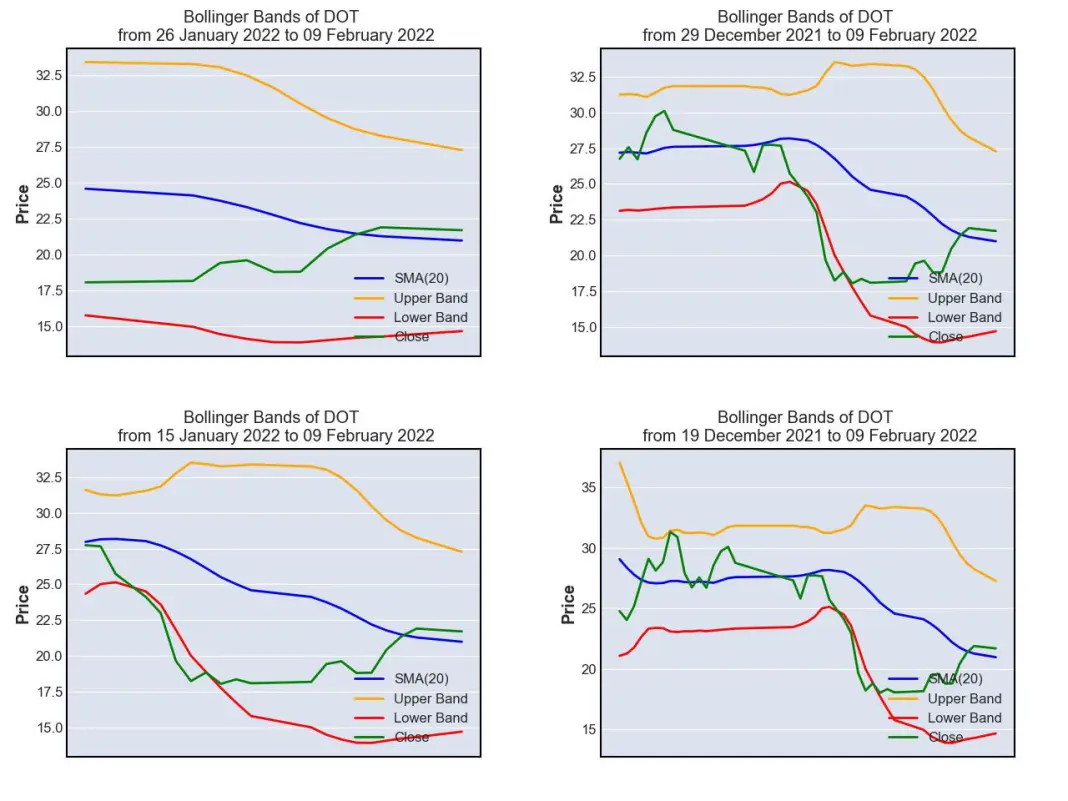
Bollinger band is often being used by mean-reversion trader as a gauge to assess how undervalued or overvalued an asset is. Its chart made up of 4 lines, namely:
- SMA (20) (blue line), which is the 20-day simple moving average price of DOT
- Upper Band (orange line), which is computed by adding 2 standard deviations of DOT on SMA (20)
- Lower Band (red line) , which is computed by subtracting 2 standard deviations of DOT from SMA (20)
- Close (green line), which is the daily closing price of DOT
Whenever close line (green) touches the lower band (red), it indicates that DOT is corrected too much and is being traded at an undervalued level, representing a 'buy' opportunity. On the other hand, whenever close line (green) touches the upper band (orange), it indicates that DOT is gaining too much momentum and is being traded at an overvalued level, thus indicating a 'sell' opportunity.
As of 08 Feb 2022, Bollinger Band is suggesting that DOT is neither overbought nor oversold.
4.4. Relative Strength Index (RSI)
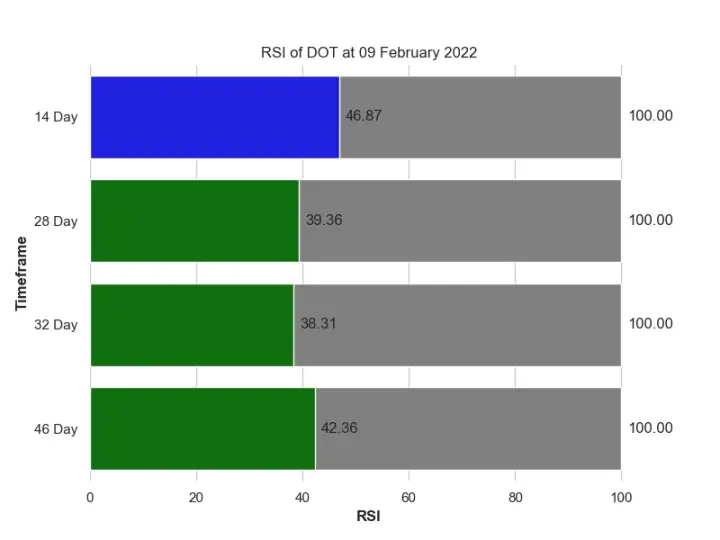
Just like Bollinger Band, Relative Strength Index is often being used by mean-reversion trader as a gauge to assess how undervalued or overvalued an asset is. There are 2 psychological levels, i.e. 30 and 70 in RSI. Whenever the RSI reaches 30, it indicates that DOT is corrected too much and is being traded at an undervalued level, representing a 'buy' opportunity. On the other hand, whenever RSI reaches 70, it indicates that DOT is gaining too much momentum and is being traded at an overvalued level, thus indicating a 'sell' opportunity.
As of 08 Feb 2022, RSI is suggesting that DOT is oversold and is now relatively undervalued.
4.5. Price and Volume Analysis
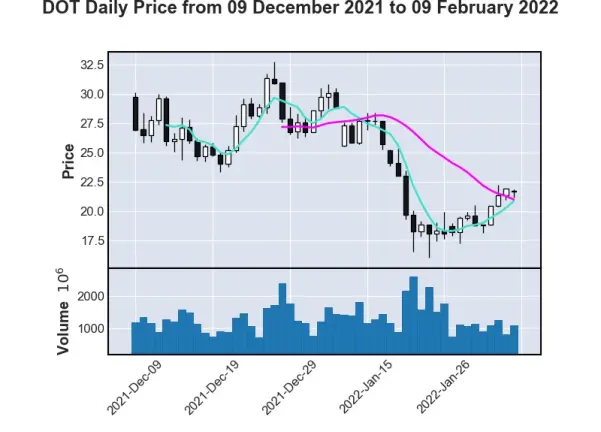
Although DOT has been steadily recovering from its low, its recent daily active trading volumes are still way less than the trading volumes during its dump around mid-Jan, and a greater amount of buying volumes may be needed for its uptrend to be sustainable.
Based on the technical analysis presented above, quantdoge is neutral on DOT, but I could be wrong, hence please make your careful due diligence before making any financial decision.
5. Polkadot Risk Profile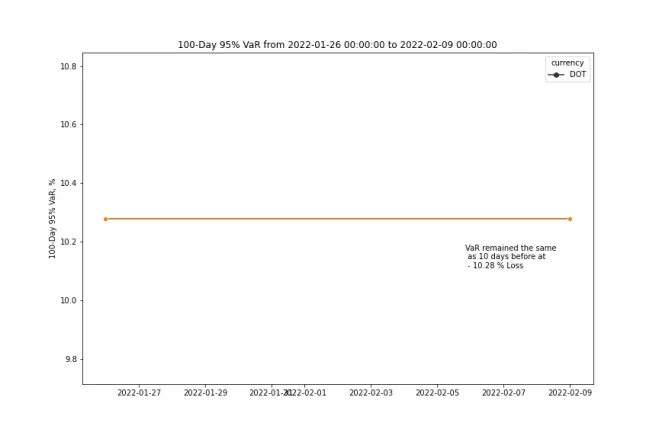
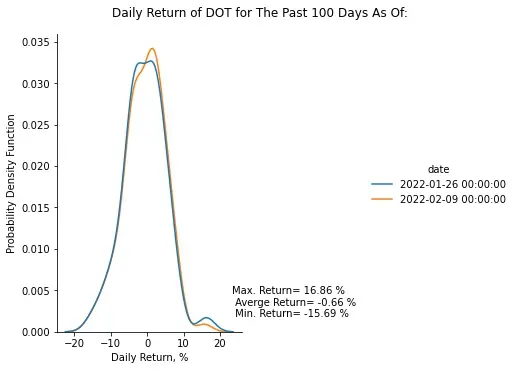
Based on the 100-day 95% historical Value-at-Risk (VaR) profile of Polkadot defined above, DOT seems to trade at a lower risk level on 08 Feb 2022 as compared to 10 days before on 29 Jan 2022, with its biggest pullback being seen at -15.69 % on a single day during the last 100 days. However, I could be wrong, hence please make your careful due diligence before making any financial decision.
The probability distribution chart of DOT's daily return has a thinner right tail now as compared to 10 days earlier, with a greater probability of making around 1% to 2% return daily on average, but with lesser probability of returning more than 10%. At the same time, its probability of losing 10% or more still stood the same as 10 days earlier.
6. DOT Community Analytics
Number of DOT Followers In The Last 30 Days
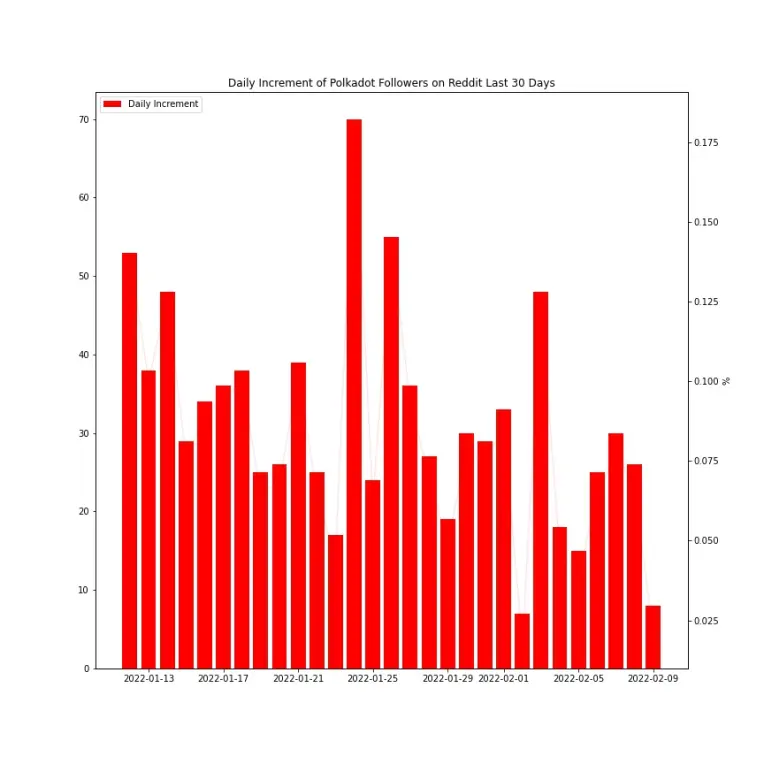
In the last 30 days alone, Polkadot's followers have grown 2.39 % from 37,925 to 38,833 on Reddit.
Daily increment of Polkadot's Reddit subscribers peaked on 24 Jan 2022.
On average, there are 31 new people subscribed to Reddit daily for the past 30 days.
7. Google Trends Analytics
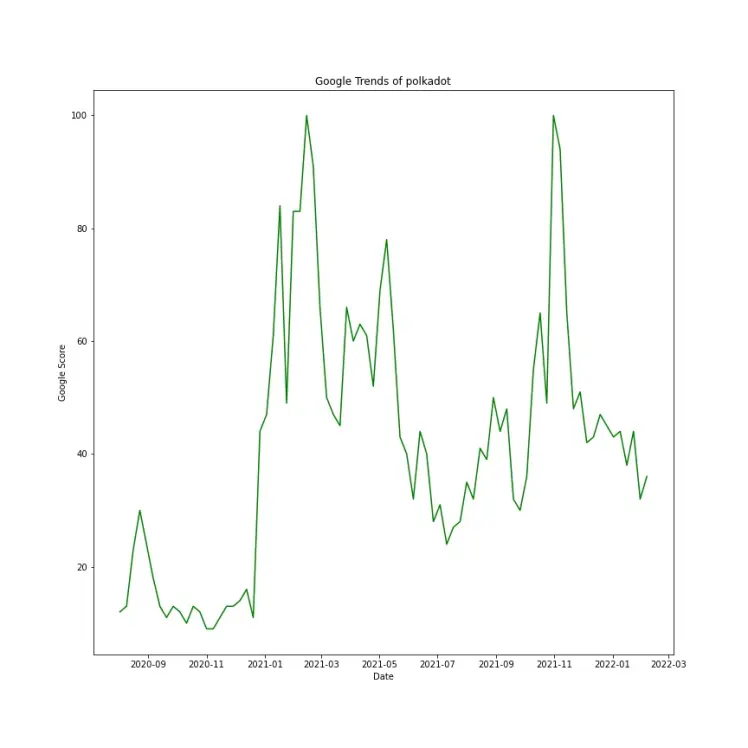
"polkadot" reached its peak in Google Search on 2021-02-14 with a Google Score of 100
Over the last quarter, "polkadot" Google Score has decreased 18.64 % from 44.25 to 36.0
Over the last 6 months, "polkadot" Google Score has decreased 6.49 % from 38.5 to 36.0 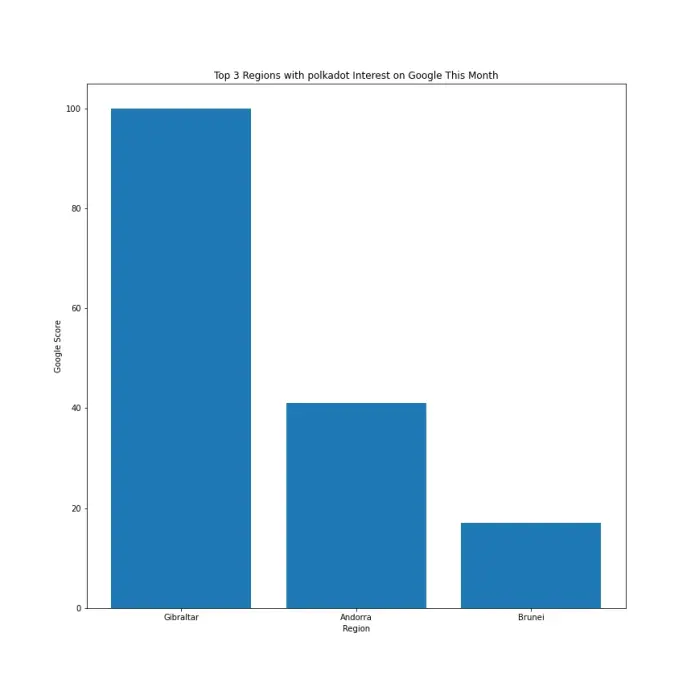
In the past 30 days, "polkadot" was most sought after on Google from Gibraltar, Andorra and Brunei.
8. Developer Activity Analytics
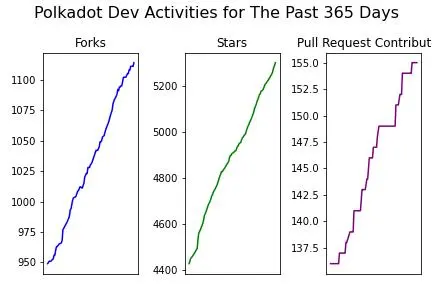
Fork
Fork refers to the amount of time where the Github repo of current cryptocurrency is being copied. Higher fork number could mean that this cryptocurrency project is getting more interest in the developers community who likes to explore more on the deep technical of this project.
Polkadot forks increased 17.39% from 949 to 1,114 in the past year.
Star
Star refers to the number of developers who bookmark the Github repo of current cryptocurrency. Higher star number could mean that this cryptocurrency project is getting more general interest in the developers community.
Polkadot stars increased 19.84% from 4,426 to 5,304 in the past year.
Pull Request
Pull request contributor refers to developer who has made a successful improvements/ modifications on the Github repo of this current cryptocurrency project. Higher number of pull request contributors could mean that there is a high number of commitment given by developers to this cryptocurrency project.
However, a low number also could mean that the developer community of this project applies a strict standard when it comes to code review, so only developers who have published a high quality code with highly impactful features got approved.
Polkadot pull request contributors increased 13.97% from 136 to 155 in the past year.
9. Binance Futures Activities
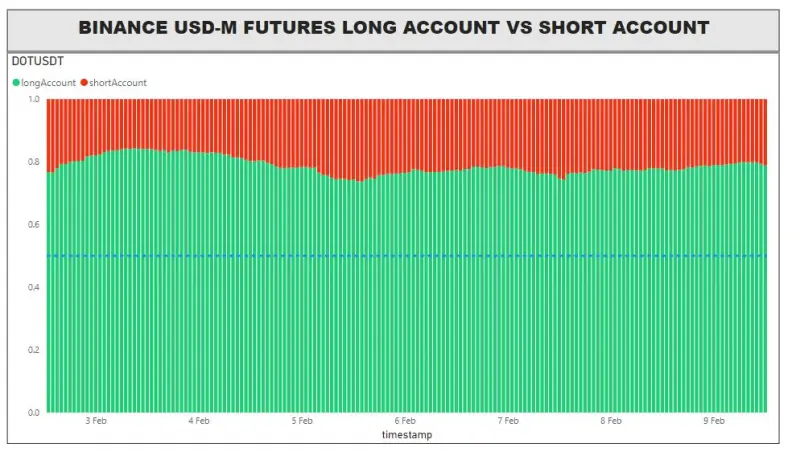
DOTUSDT futures have relatively more buyers than the sellers in this month of February.

DOTUSDT long-short ratios remain consistently higher than BTCUSDT and ETHUSDT futures. The latest data point indicates that more traders are reducing their long/ increasing their short on DOTUSDT while increasing their long/ reducing their short on BTCUSDT and ETHUSDT, a "crypto risk-off" strategy that is being observed. Please take note that this long-short ratio is simply just dividing the number of accounts who are long by the number of accounts who are short, without taking any buy/ sell volume into consideration.
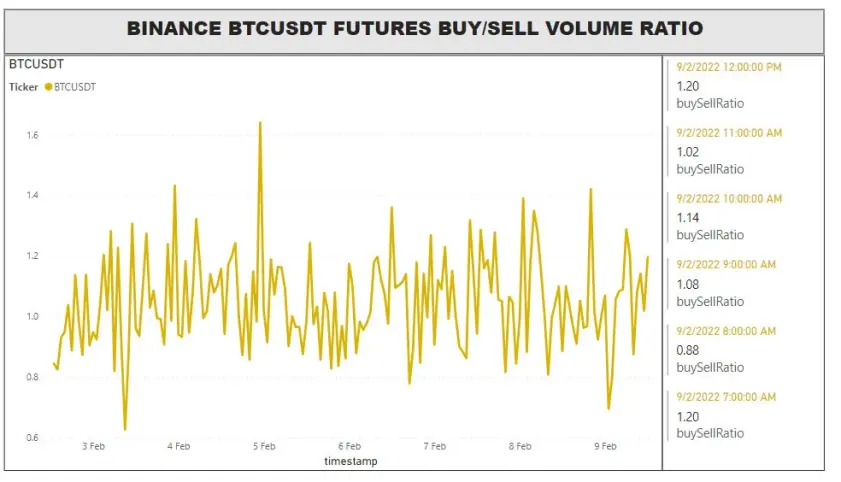
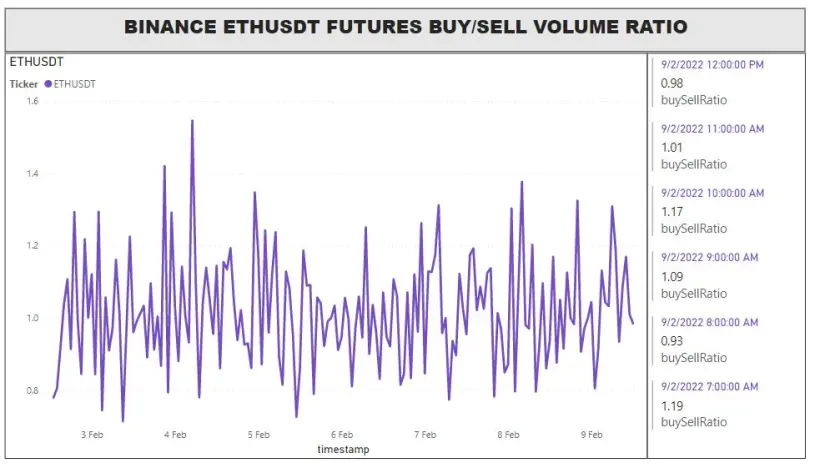
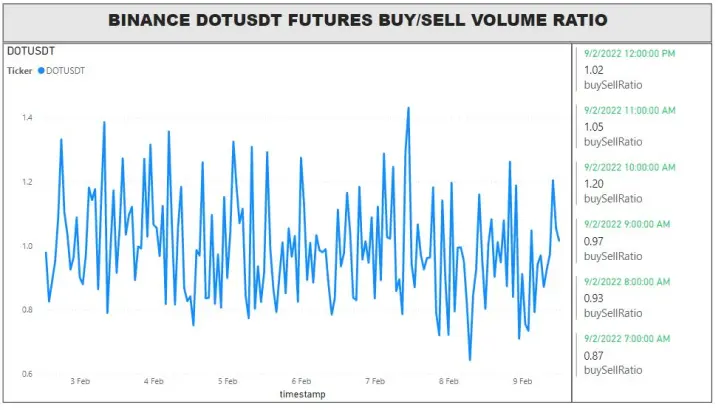
At the time of writing, buying volumes are building up on BTCUSDT futures while selling volumes are building up on both ETHUSDT and DOTUSDT futures for the past hours.
If you like my analysis and articles, please follow me at @quantdoge for daily updates.
Follow My Twitter for daily updates: https://twitter.com/quantdoge