
Btc falling 15% after make a +160% from the bottom of last down trend, the global selloff we see on february/march , the flash crash we experienced now was expected by few but wasn’t out of the blue anyway, some analysts predicted a retracement… this fast movement makes liquidation on 250 millions of Bitmex long position, also Coinbase was affected by the sale and the service was not available for a little more than 30 minutes.
Of course whales was blamed for the flash sale, in fact after such a rally we can expect that the halving event was partially yet priced and for not suffer any loss some investors could sale them position, after last sell-off we are all more careful and try to protect our gains.
A “snowball effect” hit also all the altcoin starting from Ethereum, we can see a drawdown of 10/15 percent on almost any other currency, this hit hard the recovery of the many crypto that was on them way to find again new medium term high.
BITCOIN
This chart is a countinuation of a previous study (click here to see the article)
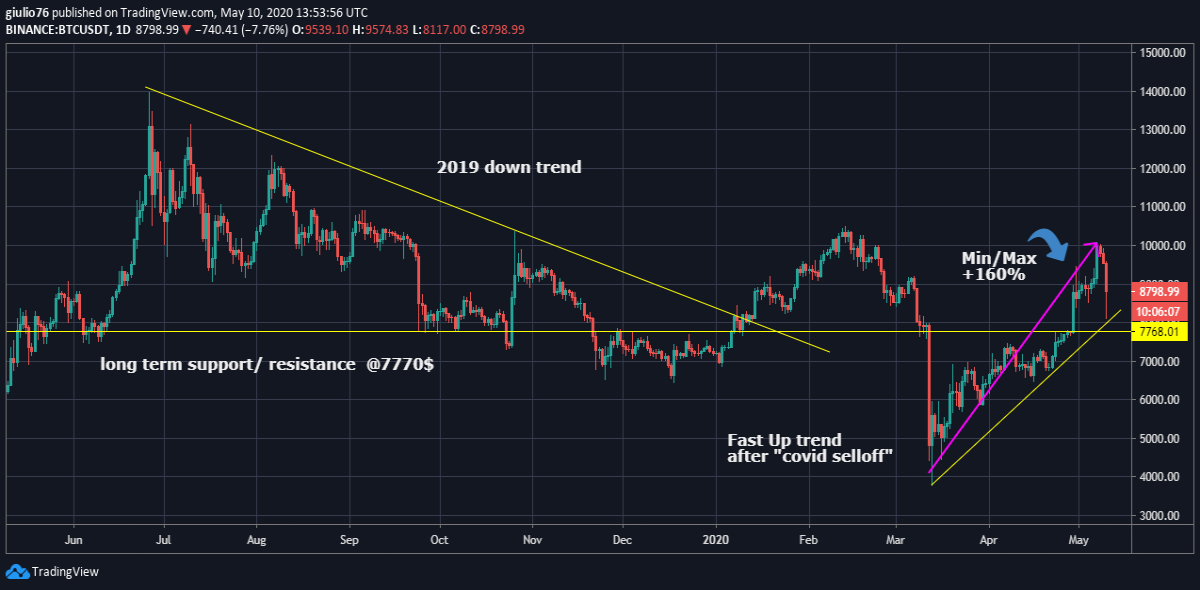
Lets see the charts of some big crypto for understand what we can expect in the near future, let’s start with Bitcoin, the uptrend that was drawn from the bottom at mid march is still solid and, even with today drawback, the trendline not suffer any breakout (watch the trendline on the chart).
Just a breakout of this trendline can change the view of this trend, in case bears can win against the bulls and push down the value of BTC we find a support at 8.000 Dollar in a 1st selling wave, the second set of support is placed at 7.700 dollar and 6.800 Dollar, we need to consider that the trendline is very steep and this play in favour of the bears.
Lets see the resistance that the bulls may face if we keep going up in the next days, the first level we may notice is at 9.200 Dollar this price may be reached quite easily and may drive the bulls at the set of resistance situated at 10.000 and 10.500 dollar, this is the real battlefield and the level that may decide the next long term trend.
ETHEREUM
This chart is a countinuation of a previous study (click here to see the article)
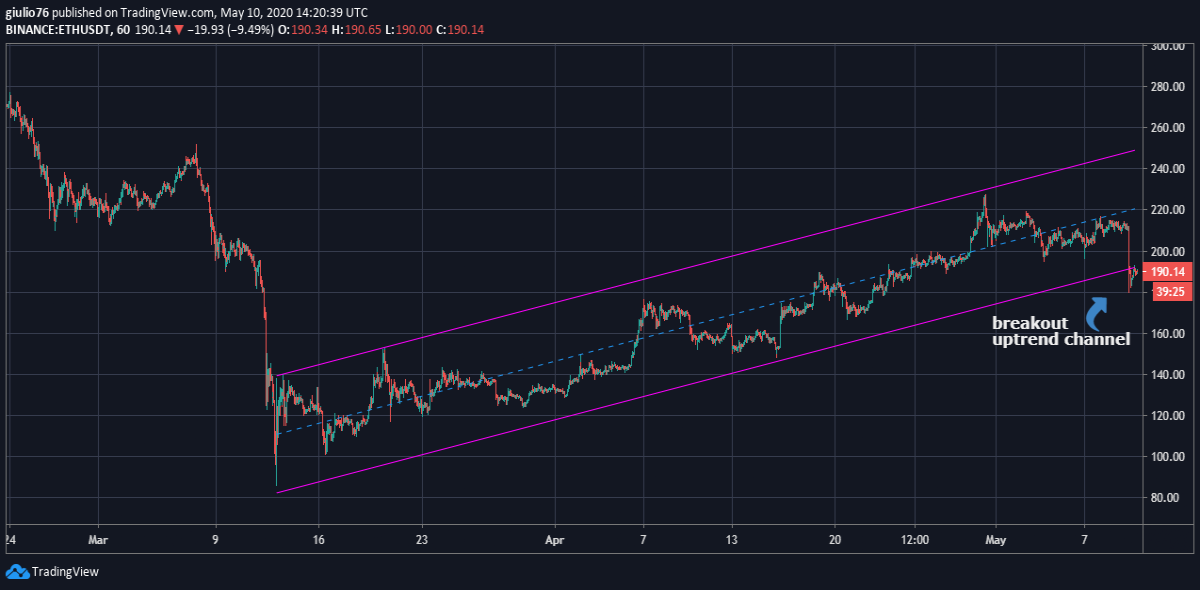
If we take a look at Ethereum chart we can see that the uptrend channel just suffer a breakout with the selloff we suffered today, this can be the start of a sideway trend, anyway is too early for predict a real breakout, movement like this one can happen and return back on track very easily.
Right now we are in a battlefield as 188/190 Dollar is a price level that usually make a lot of quantity exchanged, we may expect a support at 166 and at 152 Dollar if bears will prevail against the bulls.
200 and 215 Dollar may be two strong resistance that could slow down the uptrend that we may see if bulls can take the lead, the channel we see in the chart is a strong one and more time remain valid more we can trust in this movement.


