Good day everybody,
Welcome to CryptoGod-1's blog on all things crypto. Today we are going to continue the series on Technical Analysis and why it can be such an important asset for new or experienced traders. In this series I am covering some of the different Technical Analysis and Indicators which can be used to help determine market movement and sentiment when trading. For Part XXV the focus will be on Williams Fractals.
Williams Fractals
Williams Fractals are based on a simple price pattern principle which is frequently seen in financial markets. It is a technical analysis indicator which was introduced by the famous trader Bill Williams in his book ‘Trading Chaos’. He developed it on the basis of the Chaos Theory and through trading psychology. The basis of this theory is that although prices may seem random, they actually manifest themselves in repetitive patterns. One of the most basic repetitive patterns is a fractal, which is a simple 5-bar inversion model. The Williams Fractals is an indicator that can be used as a standalone tool or in combination with several other indicators.
Calculating Williams Fractals
To calculate Williams Fractals there is a formula used, which is shown in the image below from investopedia.com, although most people consider that calculating fractals has more to do with visual acuity than math.
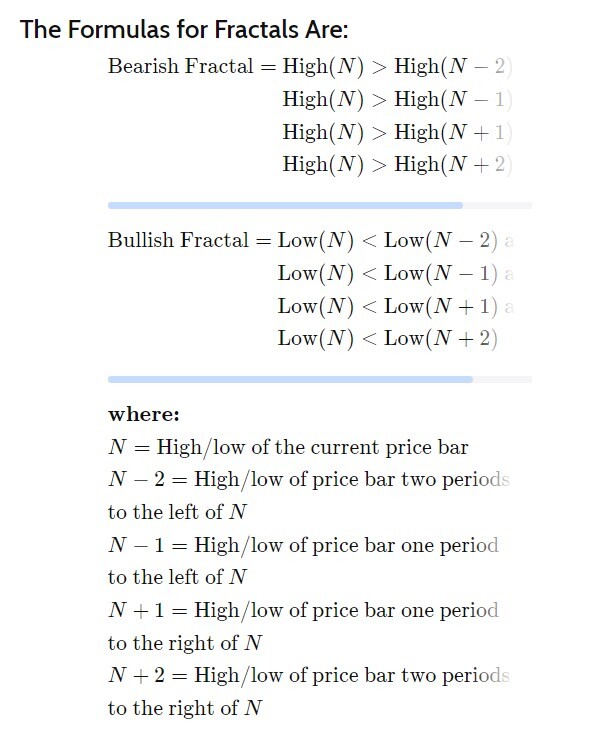
The key rules to follow when locating fractals on a chart are:
- Isolate a high/low (N) point on the candlestick chart.
- If there are two lower highs to the left of the high or two higher lows to the left of the low (N-2 and N-1), there is a possible pattern. The pattern still needs two more bars on the right to confirm.
- If two lower highs occur after the high then a bearish fractal is complete (N+1 and N+2). If two higher lows occur after the low a bullish fractal is complete.
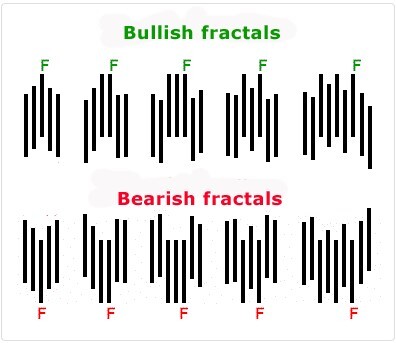
The below image of fractal examples is from forex-central.net
How to use Williams Fractals
As shown in the example above, the fractal indicator will generate signals quite frequently, but a trader should bear in mind that the existence of a fractal isn't necessarily important since the pattern is so common. There are three key principles that are used when developing the Fractals indicator.
The first is the energy of the market. It should be following the path of least resistance, meaning in most cases, an asset that is falling, will always keep falling until it finds a strong opposite energy. The next key element of this is psychology, which quite simply is that a trader will always exit a trade when the pain of losing a dollar is bigger than the pain of losing another dollar.
The second is that the path of least resistance is determined by the the underlying and unseen structure of the market.
Finally, this underlying and unseen structure can be discovered and altered.
While making use of the Fractal indicator, which is available on most trading platforms, a trader can use it in several ways
- Some use it to complement other indicators such as the moving average or RSI.
- Others use it to find a stop loss level. The stop loss is generally placed at the lower side of a down fractal, while the take profit is set above the two up fractals.
- Different traders make use of it to confirm whether or not the market is in a bullish or bearish state.
- It can also be used to determine the highest and lowest points an assets price has reached in a set period of time, and also be of use as entry and exit points.
There are multiple different variations of Fractals which a trader can identify on the chart, and some of the key points and rules to take note of while using Fractals are:
- A bullish fractal occurs when there is a low point with two higher low bars/candles on each side of it.
- A bearish fractal occurs when there is a high point with two lower high bars/candles on each side of it.
- An up arrow marks the location of a bearish fractal, while a down arrow marks the location of a bullish fractal.
- Arrows are drawn above or below the middle bar (high or low point), even though the pattern is five bars. There is no way a trader could enter a trade at the arrow because the arrow only occurs if the next two bars create the pattern.
- If someone were to trade fractal signals, the entry would be the open price of the third bar after the arrow.
- They offer an entry strategy.
- They also provide stop loss levels.
- Fractals are natural support and resistance levels.
- Over longer periods of time, fractals can indicate significant levels.
- Fractals can be useful to identify Fibonacci retracement levels.
- Fractals make it possible to identify a trend (without bias).
The below image from currency.com shows the basic understanding of how to read a Fractal, and it is imperative to always wait for the 5 candles to complete before fully reading the fractal.
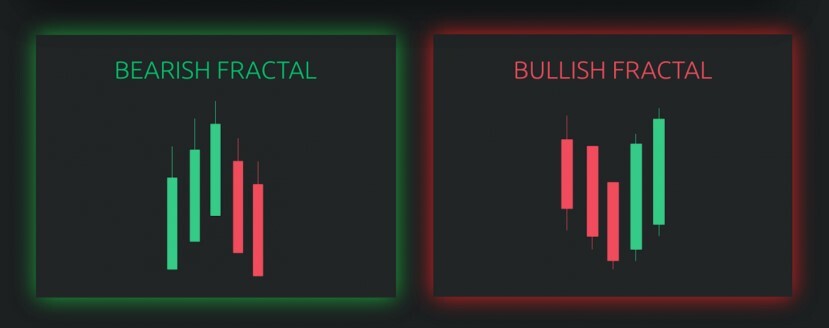
While reading the fractals, it is always the fifth candle, and the third after the arrow, which is the determining candle. To note a potential trend change, the Fractals are essentially showing a U-shape in the price action. A bearish fractal has the price moving upward and then downward, forming an upside down U. A bullish fractal occurs when the price is moving down but then starts to move up, forming a U. There is also the advantage of comparing a current Fractal with previous ones, and this can help to find areas of potential breakouts. This is done by looking at the current level of the Fractal and comparing it with the previous one. If the current Fractal set is above the last upward Fractal then in general this can indicate a buy breakout. If the current Fractal is below the previous low Fractal then it is usually taken as an indication that the short breakout if about to happen.
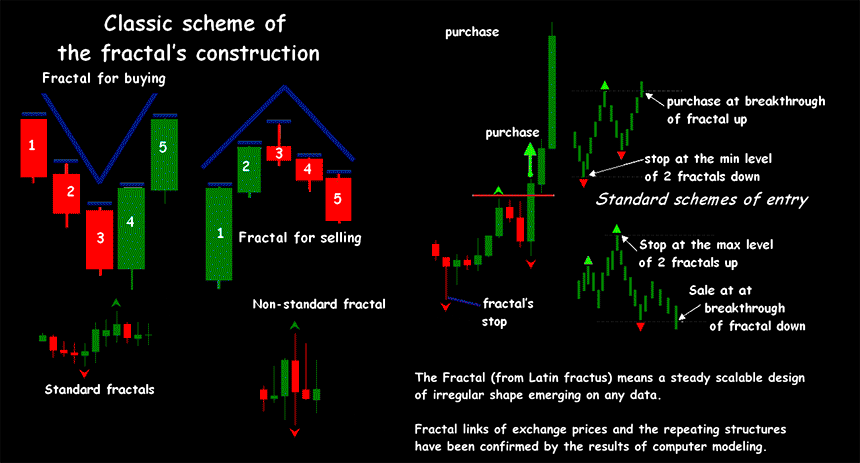
The below image from fcxchief shows a basic usecase of the Fractals.
Limitations of Williams Fractals
The most common issue when making use of the Fractals is that there are so many of them. The happen quite frequently so trying to trade even Fractal can quickly lead to loses. These are known as false signals or whipsaws, and due to this other indicators should be used to help filter out the signals.
Another issue traders should be aware of is that the arrows are generally drawn above the high or low point, which is the middle of the fractal, not where the fractal completes. This can make the arrows visually deceiving as traders may jump the gun instead of waiting for the Fractal to complete. The pattern is always complete when two two bars are complete to the right of the arrow, making the opening of the third candle to the right the first available entry point after the arrow appears for the Fractal.
Another point of the two required candles to complete the Fractal is that it makes the indicator a lagging one. While the Fractal is being completed to provide a signal, the price may have moved on to another level compared to the signal.
When trading Fractals it is best to do so in a trending market, but you should avoid using the indicator during a sideways moving market.
Conclusion on using Williams Fractals for TA
As a trader, whether it be day trading or long term trading, using Williams Fractals can be very beneficial if helping a trader to determine whether or not the market is in a bullish or bearish state, along with where a trader could place a stop loss, profit target, and to determine the highest and lowest points an assets price has reached in a set period of time. It is often best used along with other Technical Analysis indicators to filter out the sheet amount of Fractals, which are always shown in a set of five candles. The arrow determining whether or not the Fractal is bullish or bearish is shown after the third candle closes, meaning a trader needs to wait until all five Fractals are complete to confirm the signal. Therefore the William's Fractal should not be used as a standalone indicator, instead it should be used in conjunction with other indicators to give stronger results and more reliable signals, especially trend indicators.
As stated whether you are experienced or new, Technical Analysis can always be a useful asset when trading. Just remember it is not guaranteed and nobody can predict the future, no matter how certain you believe the patterns to be. It is always just another tool of the trade to help make more informed decisions when trading. It can be easy to get caught into false signals with the large number of volatile changes in the William's Fractal Indicator, and it can also show an upcoming trend reversal which never takes place as the price has moved beyond the signal of the lagging indicator.
It is important to use the William's Fractal along with other TA to get the correct signals for understanding the strength of a trend. While William's Fractal is usable on all varieties of time frame trading, a trader should always zoom out for multiple perspective's to confirm their signals. Therefore if trading on a 15 minute chart check the 1 hour or 4 hour chart to give you a better idea of the overall signal that the William's Fractal is indicating.
You can find the previous parts to the series here:
Technical Analysis - Part I - Exponential Moving Average (EMA)
Technical Analysis - Part II - Relative Strength Index (RSI)
Technical Analysis - Part III - Bollinger Bands (BB)
Technical Analysis - Part IV - Moving Average Convergence Divergence (MACD)
Technical Analysis - Part V - On-Balance Volume (OBV)
Technical Analysis - Part VI - The Average Directional Index (ADX)
Technical Analysis - Part VII - The Aroon Indicator
Technical Analysis - Part VIII - The Accumulation/Distribution Indicator (A/D)
Technical Analysis - Part IX - The Supertrend Indicator
Technical Analysis Part X - Parabolic SAR Indicator
Technical Analysis Part XI - Support & Resistance Levels
Technical Analysis Part XII - Fibonacci Retracement Levels
Technical Analysis Part XIII - The Awesome Oscillator
Technical Analysis Part XIV - The Arnaud Legoux Moving Average
Technical Analysis Part XV - Ichimoku Cloud
Technical Analysis - Part XVI - Footprint Charts
Technical Analysis - Part XVII - Heikin Ashi Candlesticks
Technical Analysis - Part XVIII - True Strength Indicator
Technical Analysis - Part XIX - The Klinger Oscillator
Technical Analysis - Part XX - Connors RSI
Technical Analysis - Part XXI - Coppock Curves
Technical Analysis - Part XXII - Weighted Moving Average
Technical Analysis - Part XXIII - TRIX Indicator
Technical Analysis - Part XXIV - McGinley Dynamic Indicator
Also feel free to check out:
I hope this post was beneficial and of some use, and each technical analysis provides different beneficial information, so combining your most trusted and favourite ones can be the best strategy for finding entry and exit points when trading. I feel that after 25 posts within this series I will bring it to a close. It has been immense fun researching and getting a better understanding of different types of TA, and hopefully you have learnt something from them along the way.
Have a great day.
Peace. CryptoGod-1.
Referral links:
Publish0x - https://www.publish0x.com/?a=olejZqrzej
Splinterlands - https://splinterlands.com?ref=rnabc1
Upland - r.upland.me/NQAH
Binance - https://accounts.binance.com/en/register?ref=143611368
NFT Market Sales
Opensea - https://opensea.io/RNabc
Follow Me :)
Twitter - @RNabc123