
Hello everyone ! In this article we will talk about an indicator that I use a lot, the Moving average.
What is a moving average
The moving average (MM) represents an average of closing prices over a given period. It is considered mobile because it is re-evaluated when the period changes. Depending on the unit of time chosen, the average changes from day to day, from week to week, from month to month, etc.
The moving average follows the evolution of the prices of an underlying asset with the objective of distinguishing a clear trend. It has the particularity of smoothing volatile or unstable movements. In some graphic configurations, the moving average could potentially play the role of support or resistance.
Keep in mind that there are 3 types of moving average that have there each particularity :
- Simple Moving Average ( SMA or MA )
- Exponential Moving Average (EMA)
- Weighted moving average
In short : The SMA is the most simple as it’s name suggest, it simply show the average price on a certain time frame, for exemple the average price for the last 10 days :
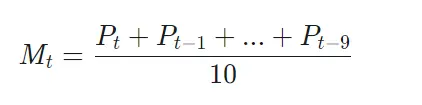
With P the price
The EMA gives more importance to the recent price allowing it to be more precise. It does that by adding an exponential in the calculation :

With alpha between 0 and 1
The weighted moving average also give more importance to the recent price but he does it not by adding exponential but by having a weighting coefficient that will make a recent price have more weight that an ancient one :

How to use it while trading
As said in the presentation you can use it to spot area where price might bounce back :
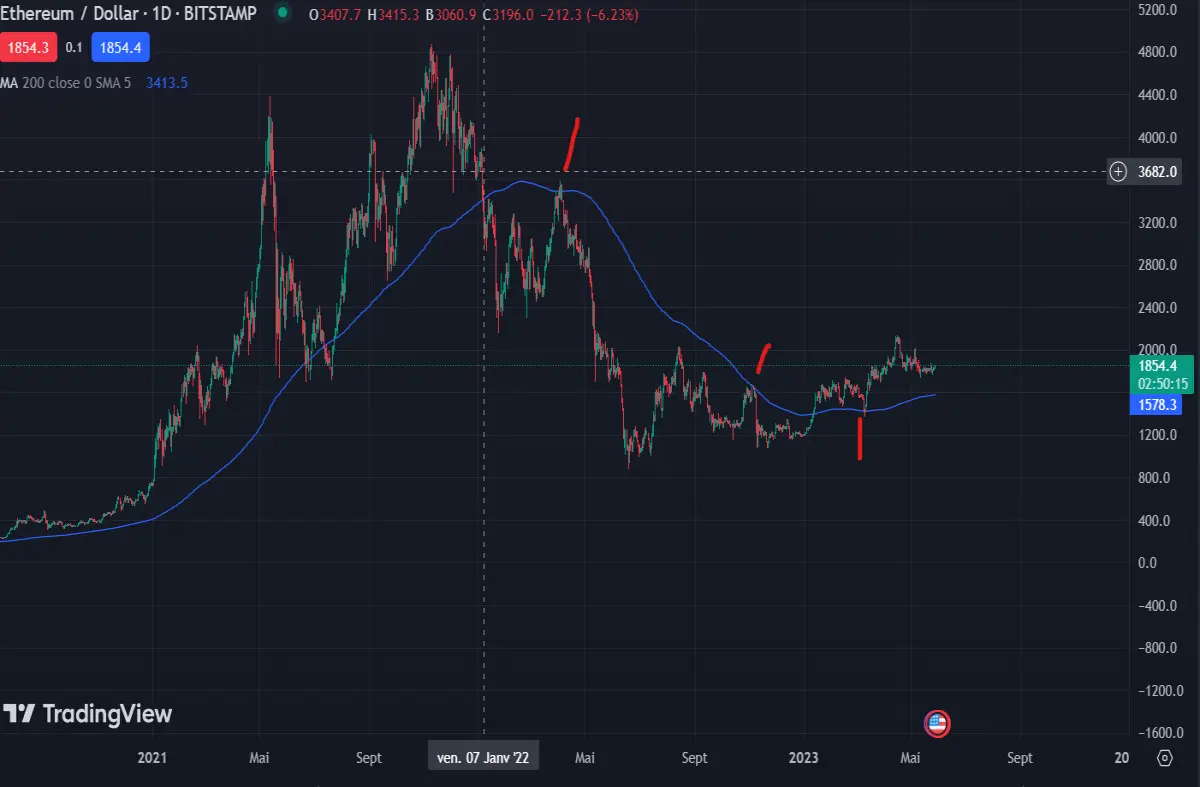
As you can see the moving average has play the role of resistance and support. The bigger the time frame the more importance it has. For exemple the EMA 200 is commonly use to allow us to know if were are in an up trend ( above the EMA 200 ) or a down trand ( Below ).
There are also some signal that are popular like the Golden cross, it happen when a MA 50 break above the MA 200 it’s a bullish signal. On the other side a Death cross is when a MA 50 break below the MA 200 :
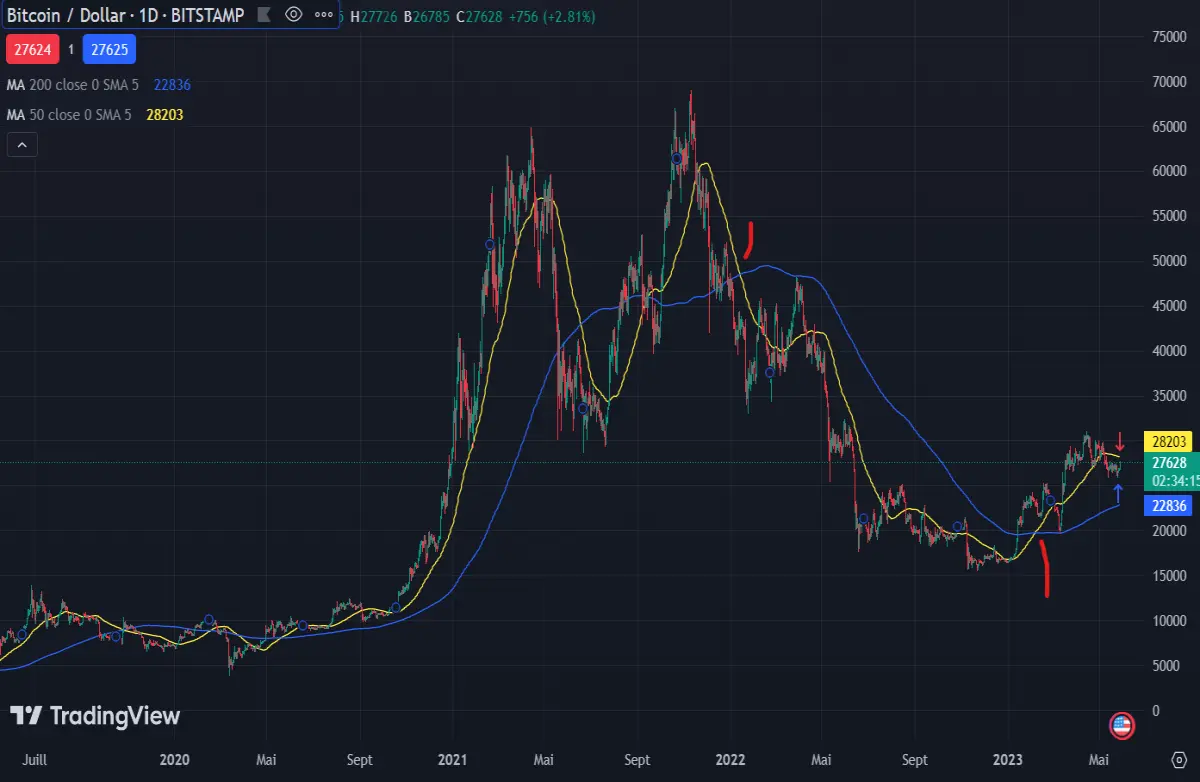
As you see the first trait show a Death cross with the MA 50 ( yellow ) crossing below the EMA 200 and the second trait show a Golden cross.
Conclusion :
The moving average is a powerful tool that needs to be combine with other indicator like the RSI or the Fibonacci to be more accurate. It’s a simple indicator that can be very important to find some good entries in the market.
Disclaimer : This is not a financial advice, always do your research before investing. Be safe !
Thank you for reading !






