
In this article we will defined what is the RSI indicator and how he can use it to detect changing trend and good opportunities.
What is the RSI
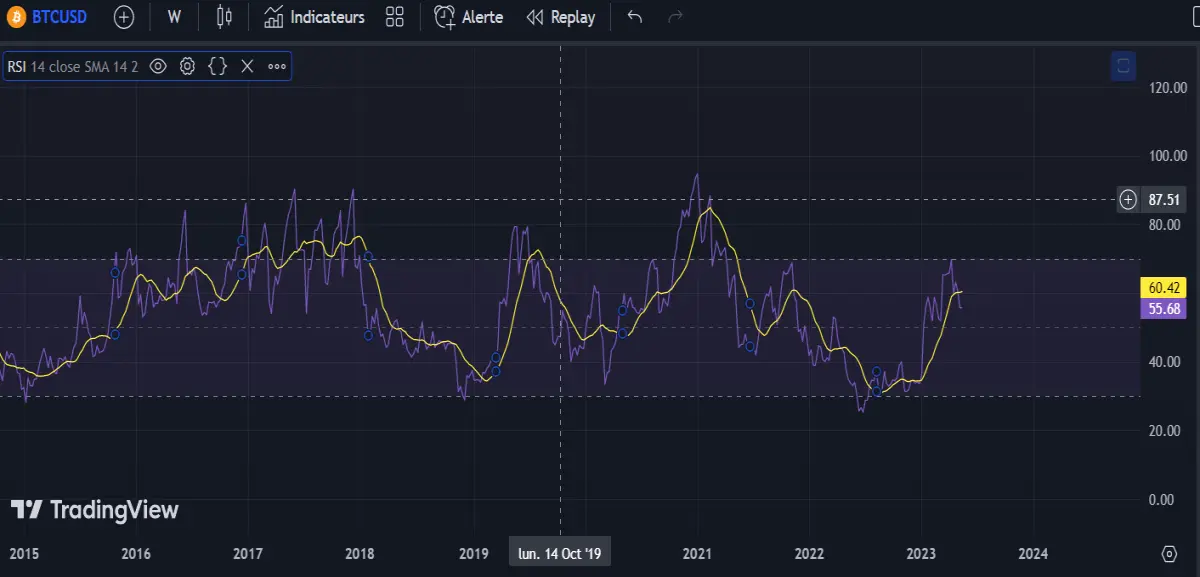
The RSI stand for “ Relative Strength Index “ it’s an indicator that help us find if the market is overbought or oversold. It’s has a range between 0-100 and is divided in 3 main zone : 2 extremity zone and one neutral.
0-30 the asset is oversold ; 30-70 it’s call the neutral zone and the higher extremity the 70-100 zone where the asset is overbought.
How can we use the RSI to find good entry point
You might think after this brief introduction that it’s so simple and that each time the RSI is above 70 I sell and each time it goes below 30 i buy. Well it’s not that simple because the price of an asset can still be going up sometimes much higher even tho it’s in the 70-100 range. For exemple :
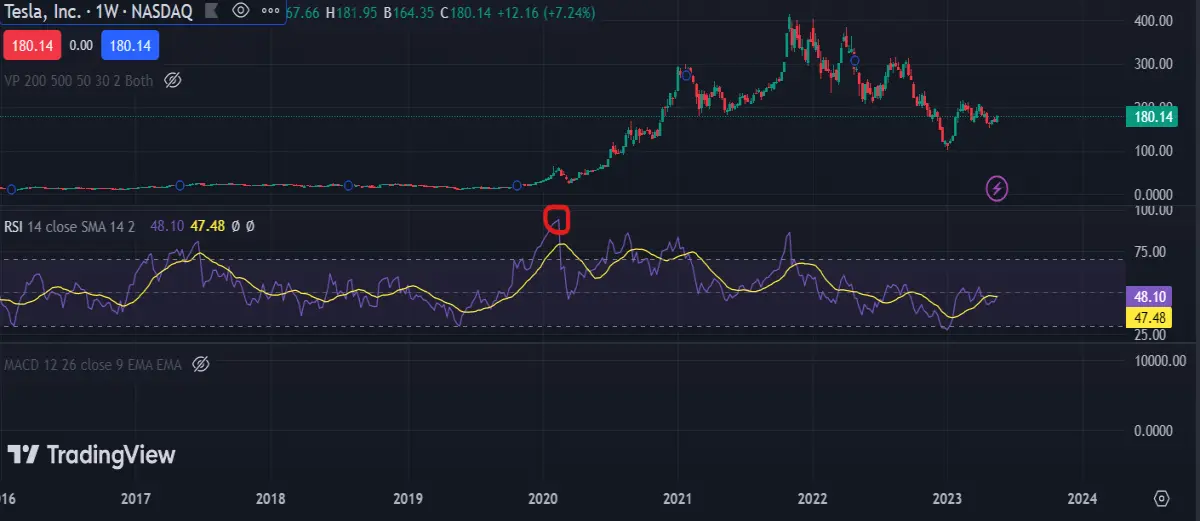
If you have done that for the Tesla stock you would’ve have sold it for 50 dollars but as you can see the price keep going up. So that’s why you can’t only rely on the RSI to find a good trade. For me the RSI is very very good to find changing trends. In fact I only use RSI to find what’s call a divergence. It’s when the price keep making higher high and the RSI lower low. That means that the buying power is losing it’s momentum. In the same exemple we can clearly see a bearish divergence where the RSI is making lower low and the price higher high.
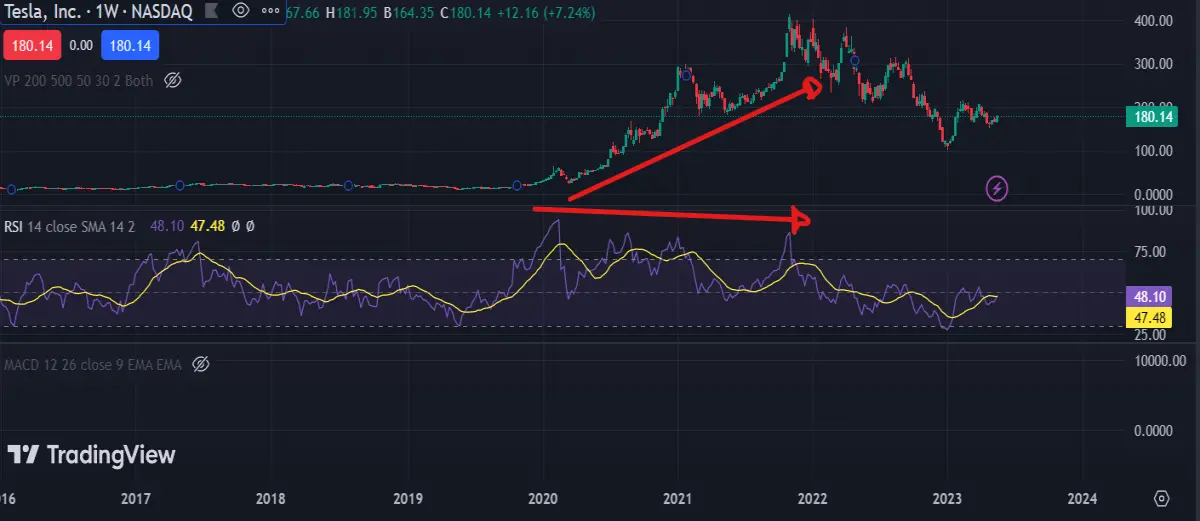
Nevertheless, the RSI can have a very long divergence, you can see here that it lasted 2 years. The step i like to follow is when the price brake below the trend line ( the upper red arrow ) that there is a very high chance that the momentum has become bearish ( we can see that’s the case here )
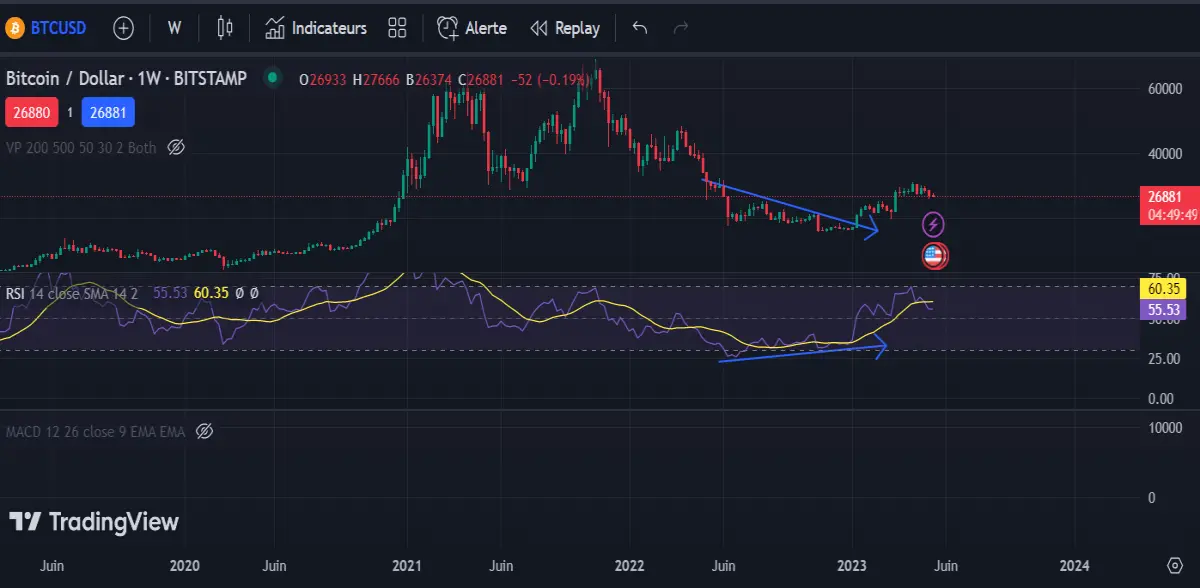
The same apply for a bullish divergence, we have to wait for a breakout to enter a trade :
Conclusion :
The RSI work best in a trending market as a momentum indicator. Of course it’s not a magical tool but if use correctly it can really help your trading strategy. Feel free to ask any questions. Have a nice day
Disclaimer : This is not a financial advice be careful when investing

As always, thank you for reading !






