
In today article with are going to talk about one of my favorite tool i use to trade : The Fibonacci Retracement. We are going to explore what is it and how to use it properly.
Why is call Fibonacci
First of all it there is a lot of Fibonacci indicators as the Fibonacci extensions or canal. They all come from one man, an Italian mathematician : Leonardo Fibonacci

It is based a succession of numbers that we get by adding the 2 precedent number ( exemple : 3+2 = 5 ) : 1 ; 2 ; 3 ; 5 ; 8 and so on…
When divide a number of this suite by the precedent when get a result close to 1.618 which is call the golden ratio.
In this article we are only going to talk about the Fibonacci retracement which is the most use.
What is the Fibonacci Retracement
Firstly in order to exploit the full potential of the retracement you need to use it after you have identify a down or up trend.
A Fibonacci Retracement has different levels the most importants are 0.382 ; 0.5 ; 0.618
As you know the price always evolve with the characteristic saw tooth scheme : Here is a bullish exemple :
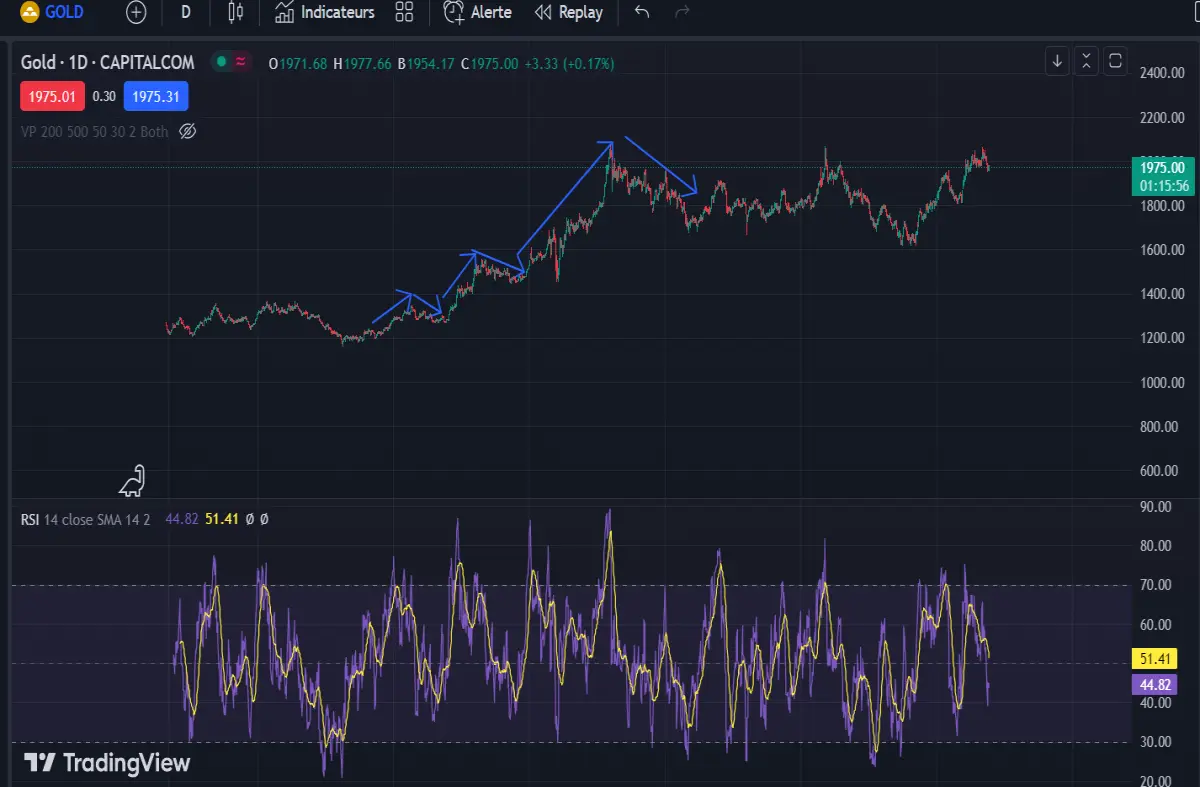
It is essentially use to find levels were the correction of the price might bounce back.
A Fibonacci Retracement has different levels the most important are 0.382 ; 0.5 ; 0.618 those are the levels were the price has the most chance to end his correction. We are going to show this with our previous exemple :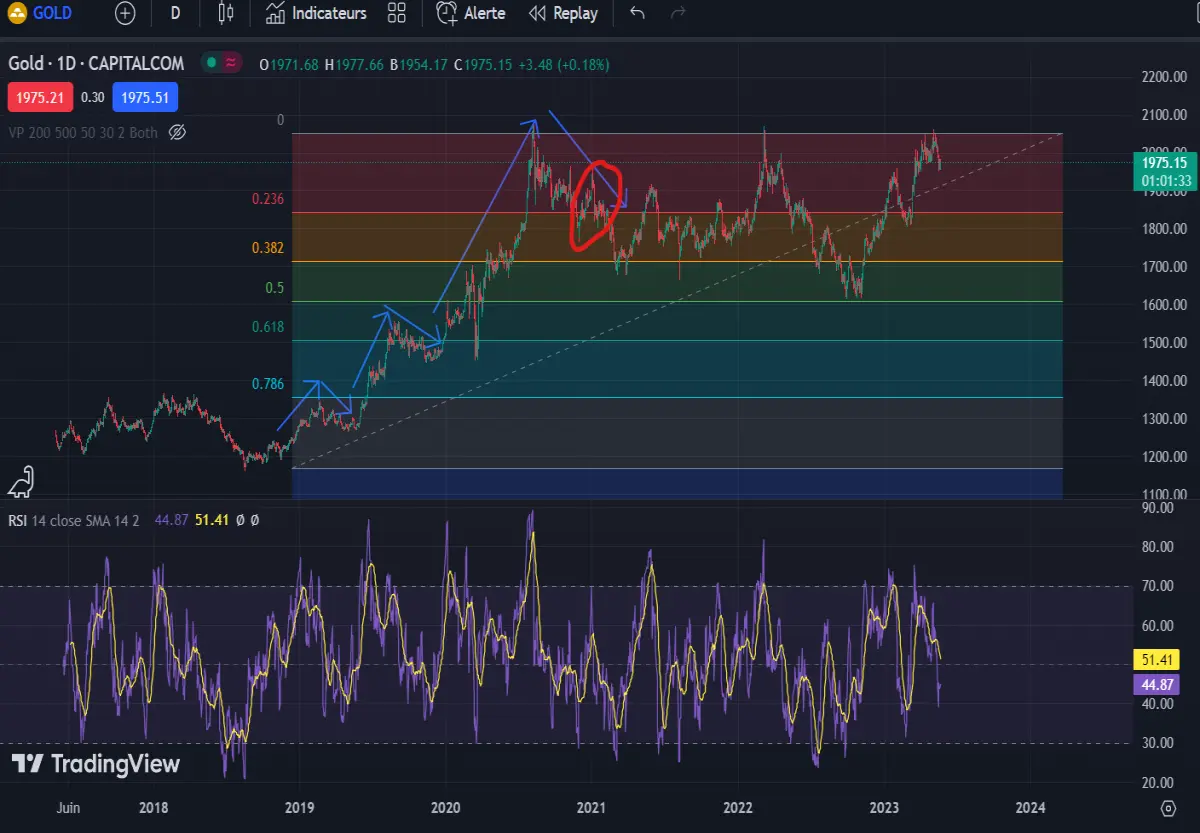
We retrace the price from the bottom of the uptrend to the top. In this time frame we want to know were this strong uptrend is going to bounce, we see that the 0.382 played a great zone of support.
For the “mini” uptrend we need to use a smaller time frame but the idea is the same, we are going to look more closely the red circle :
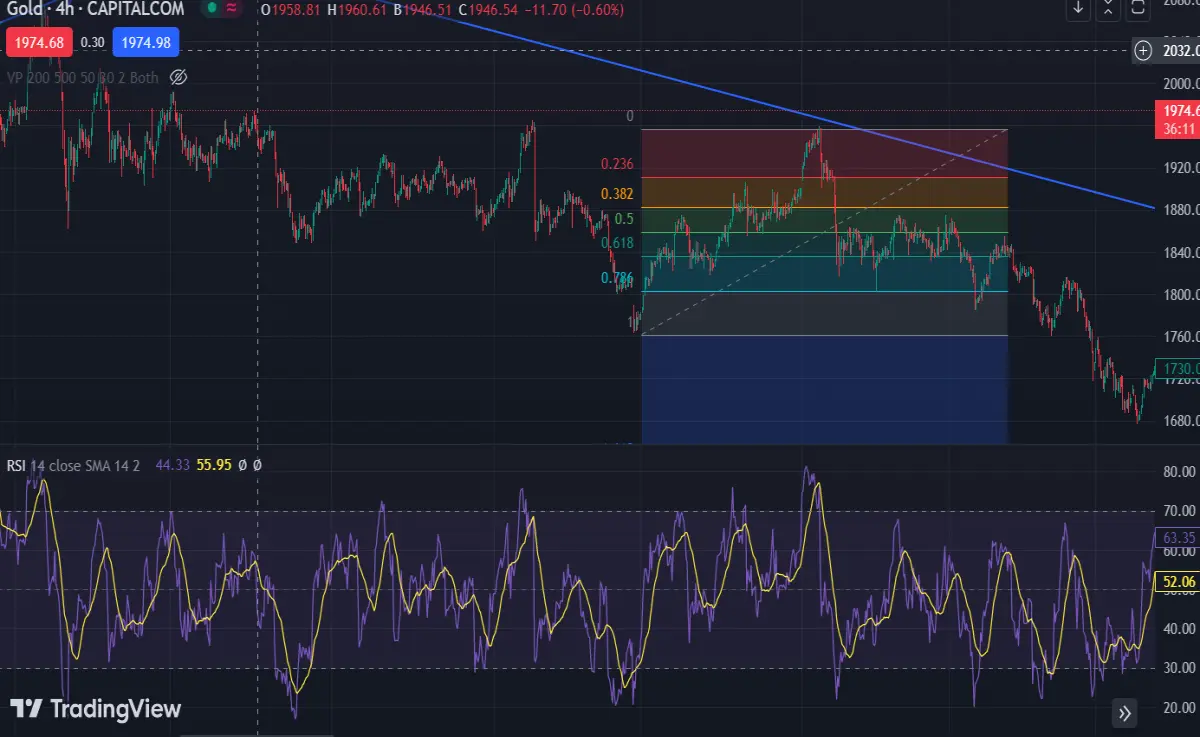
Up trend detected, we put the retracement from the bottom to the top, we see the price testing the 0.618 but finally it break the support. Usually when the price breaks a level he goes to the nearest next level.
For a down trend it’s the same but the number are reversed :
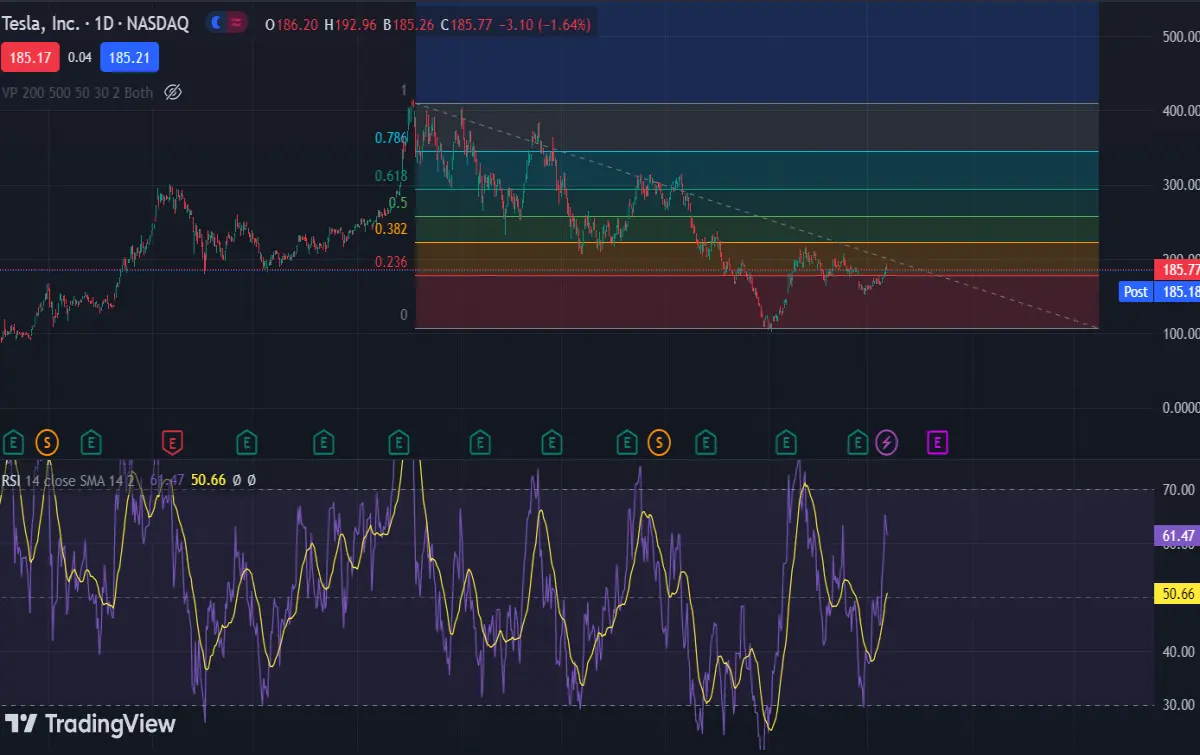
We retrace from the top all the way down to the bottom. We can now identify possible resistance levels.
Conclusion :
The Fibonacci retracement is not really an indicator because it really depends how we place it and interpret it. You need to combine it with trend line, RSI, resistance and support etc..
Disclaimer : this is not an article that encourage trading it’s for information only, if you want to try it, I recommend using a demo account and do complementary research. Be safe !

As always, thank you for reading !






