
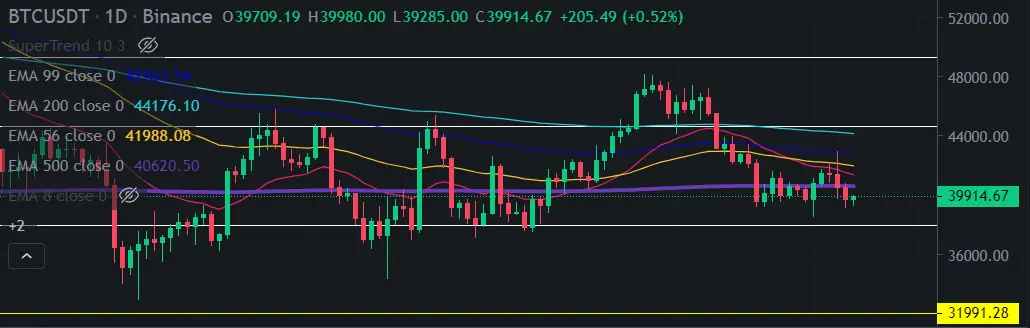
Bitcoin Analysis
BTC hold but made an inside bar below EMA500 which is still not good and just delayed the fall in my opinion.
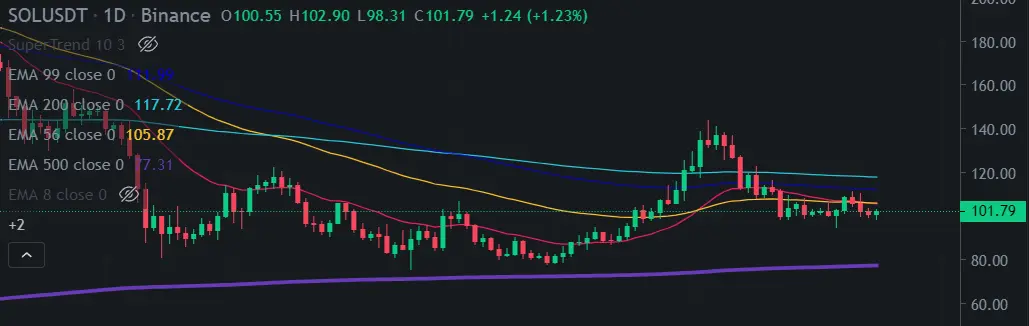
Solana Analysis
SOL is doing the same but this one could still hold above EMA500.
Fantom Analysis
FTM broke EMA500 and is ready to break 1$ but in my opinion it's not gonna go much lower than 1$.

Statera Analysis
STA didn't manage to break the previous resistance and is now trying to break the last support if that happen then it's going to be sideways until the next bull market.

Are you a good gamer? Pipeflare is giving 2000$ per month to players who can get the best scores in their games Playing for 15 min, don't lose this opportunity!
Supertrend Indicator Daily and Weekly
_____________________________________________
BTC | Weekly chart | Down Trend |
| Daily chart | Down Trend |
_____________________________________________
FTM | Weekly chart | Down Trend |
| Daily chart | Down Trend |
______________________________________________
SOL | Weekly chart | Down Trend |
| Daily chart | Down Trend |
______________________________________________
STA | Weekly chart | Down trend |
| Daily chart | Down trend |
______________________________________________
RSI Indicator
Bitcoin
Fantom
Solana
Statera

Suports and resistences
_____________________________________________
BTC | Suport -> 45K
| Resistence -> 50K
______________________________________________
FTM | Suport -> 1.45$
| Resistence ->1.70$
_____________________________________________
SOL | Suport -> 125$
| Resistence ->140$
______________________________________________
STA | Suport -> 0.08
| Resistence -> 0.10
______________________________________________
Volume (in the last 7 days)
_____________________________________________
BTC | 50k->46k Lower.
______________________________________________
FTM | 103M->68M Lower.
_____________________________________________
SOL | 2.1M->1.1M Lower.
______________________________________________
STA | 500K->250KM Lower.
______________________________________________






