
Bullish Scenario
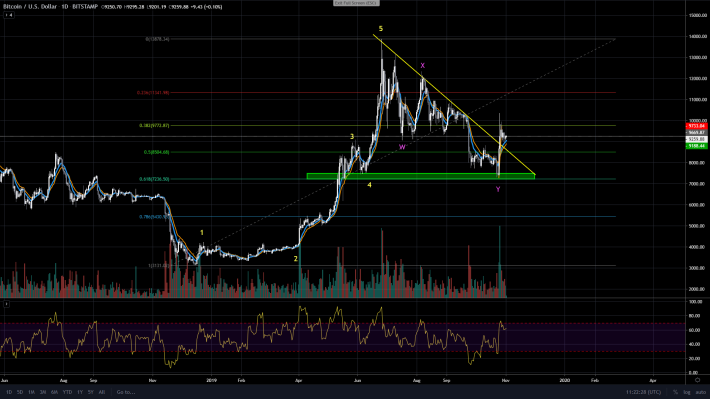
As the picture shows above, we believe that an entire Elliott Wave Cycle has ended. We can see a 5 Wave Impulse move to the upside followed by a WXY Correction pattern. There are several reasons why we think this is the case:
- When we draw the Fib Extension tool from the swing low to the swing high of the Cycle, we can see that the Price almost touched the 0.618 Fib level which also coincides whit the Support Zone between 7200$-7400$.
- Wave Y has reached a 1to1 ratio when measured against wave W and X( using Trend Based Fib. Extension tool).
- We have seen a strong reaction once the Support Zone and the Golden Fib level(0.618) has been reached, on a good Volume.
Now,determining the start of a new Cycle is quite hard, because we will not know for sure that what we are seeing on the Chart right now is the start of the new Wave 1, or we are still correcting, until Wave 2 has concluded, meaning it has reached some of the important Fib Retracement levels and found a Support.
Let's see what the Chart reveals when we draw the Fib Extension Tool on the believed to be Wave 1.
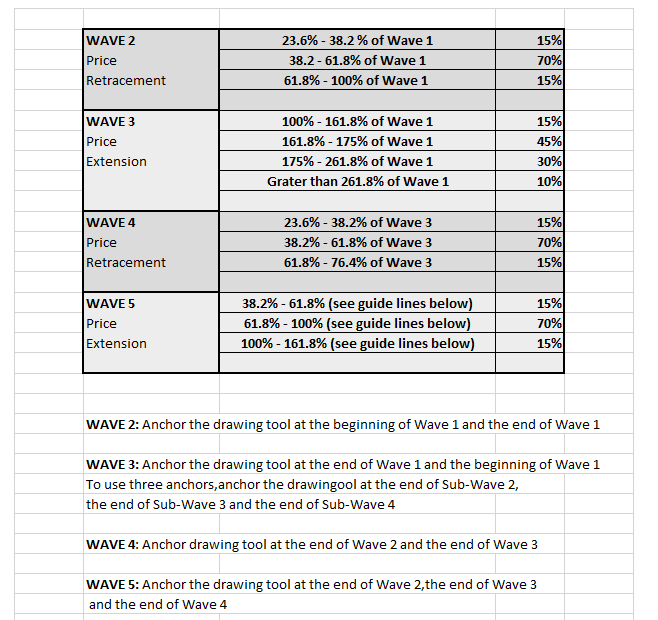
A little Cheat Sheet for You guys :)
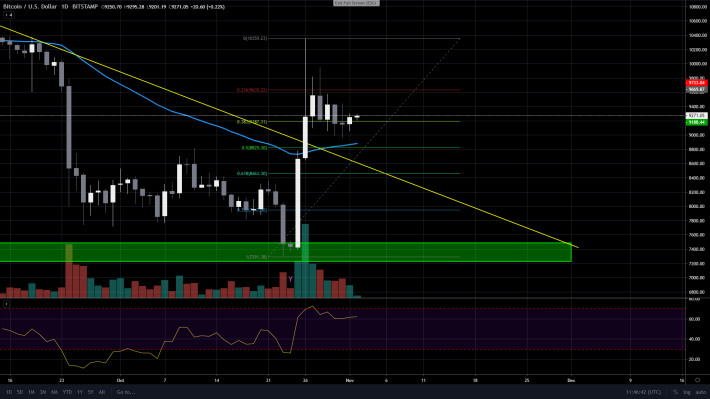
As we can see the Price is currently sitting around the 0.38 Fib Level and not only that, but the 50EMA is also right below this Fib level and it looks like it is going to act as Support. Ideally, what we should see now is a strong move, on a good Volume, to the upside, and go past the Peak of Wave 1, which could mark the beginning of Wave 3 and BTC should start challenging the previous high at 14K.
Bearish Scenario
Now, before we get too excited, we also need to look at a Bearish Scenario, because we don't want to make the Biggest Mistake what most of the Crypto Market Participants are making, all the time, ( it is heartbreaking to see) and that is to be stuck in a Tunnel Vision Mode and only see and entertain the idea of a Positive outcome. This is a Huge Mistake! As Traders, Investors or Speculators, we should be prepared for both outcomes and not get surprised when the Market decides to do the ,, Unexpected''.
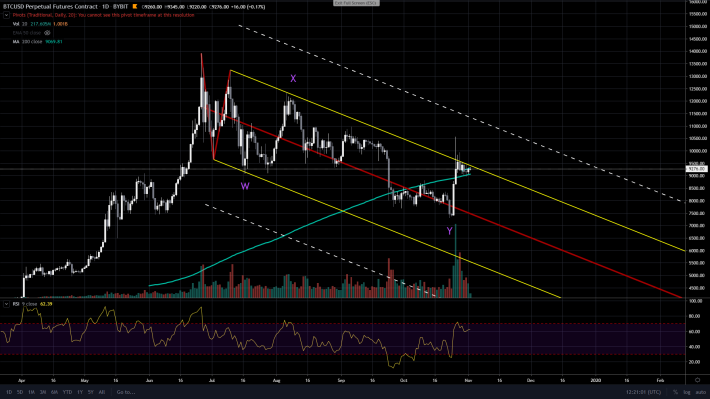
As we can see, BTC has been stuck in this Schiff Pitchfork for a long long time. Basically, from the beginning of the Correction Phase the Price could not close above the Yellow median line( at least on the Daily Chart that is). This is Concerning a little bit, because BTC has just managed to conquer the 200 MA and now, once again, it is being pushed down towards it by the Fork and there is also a strong Overhead Resistance Zone between 9400-9500k. If the Battle between these two opposing forces is won by the Median line, BTC can experience a sharp decline back towards the mid 8k levels.
Time is running short, because if BTC stays on this trajectory, then the 200 MA should reach the Median Line around the 8-9th of November. BTC should reveal to us where it wants to go from here as soon as next week. (or tomorrow :)
P.S
By the time You read this article the Price may have already moved.
----------------------------------------------------------------------
Did you know that the easiest way to Support our work is to leave an Upvote? It will encourage Us to create more Quality Content for You Guys.
Cheers
EliteElliott Team


