
Yesterday evening, the S&P 500 and Nasdaq recorded new all-time highs, continuing the bullish run of the American markets. All of this occurred against a backdrop of open conflict, without positive developments toward an end to USA–Iran hostilities. There are also no signs of a reopening of the Strait of Hormuz. The only positive note is that the truce is currently holding.
S&P 500 and Nasdaq Hit New All-Time Records
The crypto market remained in a mixed phase, although it closed in positive territory yesterday. Despite the non-directional day, Bitcoin posted a +0.90% gain, while Ethereum recorded +1.62%. The crypto sector moved in a patchy fashion, with significant rallies among altcoins.
 Top Crypto 20 april 2026
Notable movements include Aave with a +5.60% gain. Pepe is recording a +7% rise in the early hours of today. Aptos is also showing a +6% increase over the last 24 hours. The month of April is proving positive for most of the Top 20 cryptos by market cap, with Hyperliquid at +24.50%, followed by SUI, Ethereum, and Bitcoin, all recording performances between +10% and 12%.
New Records for S&P 500 and Nasdaq
The S&P 500 future recorded its new ATH at 7,077.50 points, while the Nasdaq reached 26.465.25 points. Both broke their respective highs with yesterday's close. The Nasdaq has registered eight consecutive positive sessions and broke its ATH, which had stood since October 30. The Dow Jones, however, is still about +3.90% away from its ATH.
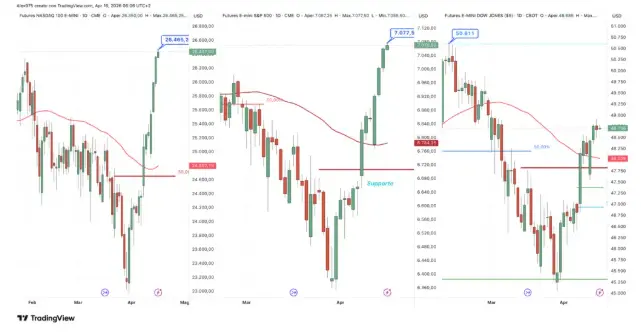
This movement signals a strong return of attention toward the technology sector, with significant moves among Big Tech: Microsoft at +4.60%, Tesla at +7.62%, and Apple at +2.90%.
Bitcoin Closed Above Resistance
The price of Bitcoin (BTC), currently trading at 74,900 USDT, closed yesterday above its resistance level of 74,500 USDT—a level that had capped the price in March and where it has been struggling for several days.
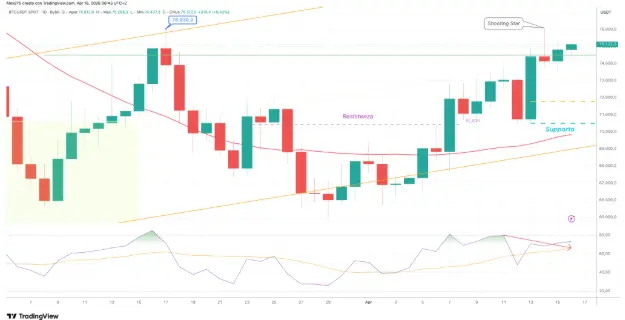
On the daily chart, a Shooting Star candle is visible but has not been confirmed. To invalidate it, a daily close in the 76,000 USDT area is needed; to confirm it, a close below 74,400 USDT. The more sessions pass without bearish confirmation, the more the market is effectively absorbing the signal, leading the pattern to invalidate itself.
Regarding supports, the first is in the 71,800 USDT area, while the next and main support is at 70,500 USDT, where the SMA50 passes just below.
Negative Funding Rate for BTC and Potential Short Squeeze
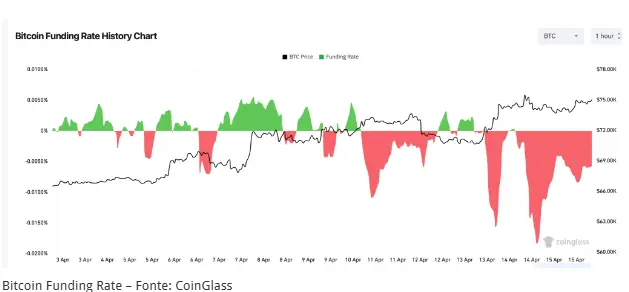
This situation persists today. As seen in the 1H chart, the average value is negative, with extreme downward spikes even lower than the February lows, indicating a predominance of short positions. In this context, bearish traders are effectively paying to keep their positions open. This setup was likely built specifically at the 74,500 USDT resistance level, with the market betting on a retracement from this area.
However, the BTC price continues to climb, creating a significant divergence between sentiment and market performance. This scenario signals stress on the short side and increases the probability of a short squeeze, with potential sudden bullish moves. A short squeeze is a rapid price surge that forces short traders to close their positions by buying back BTC, fueling further gains in a chain reaction.





