
Algorand is one of the highly traded cryptocurrencies along with the high market cap in the space. It has been launched in June 2019 with an auction held over CoinList, one of the best launchpads in the crypto space. Algorand is a smart contract platform with its native currency ALGO. You can consider Algorand similar to Ethereum but with some different features such as the use of PPoS (Pure Proof-Of-Stake), instead of the PoS Algorand uses PPoS. And it is also considered as one of the highly invested cryptocurrencies in the space. So in this article, we will look into the daily chart of Algorand and analyze it with the help of some common indicators. Before going forward in this analysis, please consider reading the note:
Note: The purpose of this Technical Analysis is to show the use of indicators and understand their meanings. So before making any financial decisions do your own research. Now sit back and enjoy the analysis!!
Support & Resistance
As always we will start this analysis by drawing some primary support as well as resistance zones which will help us to understand how the market is reacting to specific zones. You can check the chart ALGO/USDT of the daily timeframe with support and resistance zones below:

Current Support Zones
Primary Support Zones: $0.695 - $0.71
For now, there is only one near support zone which is acting as a primary support zone on the daily timeframe. And you can see the price is approaching the support level and testing it. The price must have respect that support zone otherwise there will be high down pressure. But note down this support has been tested in the May of 2021.
Current Resistance Zone
Primary Resistance Zone: $0.99 - $1
Secondary Resistance Zone: $1.24 - $1.26
Recently, the price has been tested on the primary resistance zone, in which it got rejected and is now approaching the nearest support zone which you can see in the chart above. This resistance zone will be the crucial zone for the price in the trend reversal scenario. In case the primary resistance zone gets breakout the next secondary resistance zone is ~$1, which is there for a long time and has also been tested in the past. The price has formed a Lower High and Lower Low an indication of a downtrend.
What Are Indications From Indicators
We have seen the possible support as well as resistance zones in the daily chart now it's time to look for the indications from the various indicators.
Smooth Moving Average (SMA 200)
As we all know now that the Smooth Moving Average gives us an indication of the long-term trend and as you can see in the chart above that the price is currently holding below SMA 200 line which indicates that the price is in a downtrend. Price has to break above in order to continue its uptrend.
MACD & RSI (Moving Average Convergence Divergence & Relative Strength Index)
MACD line and the Signal line both are moving closely but yesterday a crosstown between the MACD line and Signal line has been seen along with the reddish histogram suggesting the downtrend ahead. It is possible to see some hard testing over the primary support zone.
Currently, the Relative Strength Index (RSI) is at ~38 and the closing RSI of yesterday was at 34, showing the weakening strength. From RSI we can consider that the price is in a downtrend as RSI is less than 45 and it is also greater than 30 indicating it is not oversold yet.
On Balance Volume (OBV)
This is one of the indicators that I often use while technical analysis, you might find it for the first time if you have not read my previous analysis. This indicates the difference between volume on up & down days showing the strength of bulls and bears. Here in the chart, you can see there is a downward slope for yesterday which shows bears are still dominating the market but in the unclosed means today's OBV which has an upward slope shows that the bulls are fighting back.
Check out the overall trade set up of ALGO/USDT on a daily timeframe: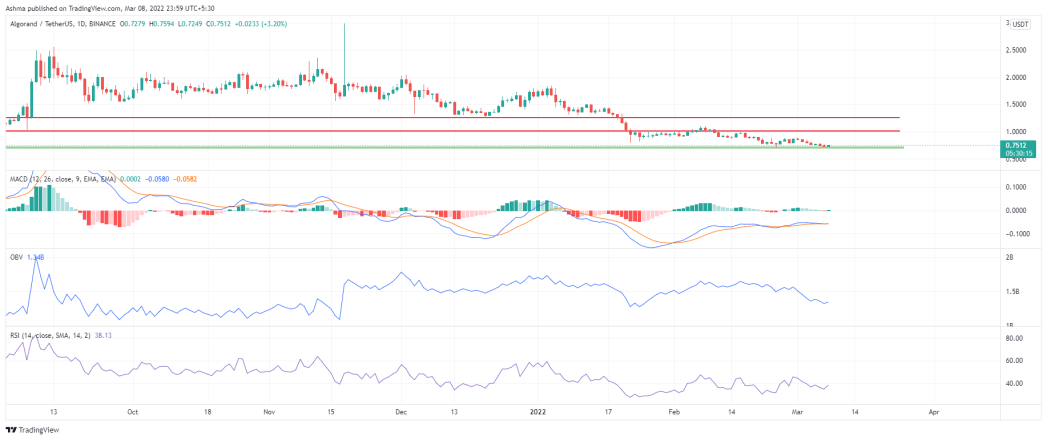
Conclusion
We have looked at the support & resistance zones and various indicators, we can derive a conclusion that the price is in a downtrend for now. As the formation of Lower High and Lower Low, MACD indicates a downward shift of momentum along with RSI and on OBV there is a fightback from bulls but the overall trend since the previous downslope of a week.
Hope you found this article informative and learned the use of basic trading indicators as well as trendlines over the chart. Do share your opinion on this analysis and your overall opinion on the current situations of crypto market and about the Algorand (ALGO). Have you invested in Algorand?


