
Hello everyone, today i intend to share my study where i do a technical and sentiment analysis of the market and the position of institutional traders who negotiate bitcoin futures contracts on the Chicago Mercantile Exchange, finally showing the possibilities that i project for the future of bitcoin price.
Before starting the analysis, I would like to bring you a fantastic study that I read on coindesk (you can read it in full by clicking here) which shows the short squeeze that was at bitmex.
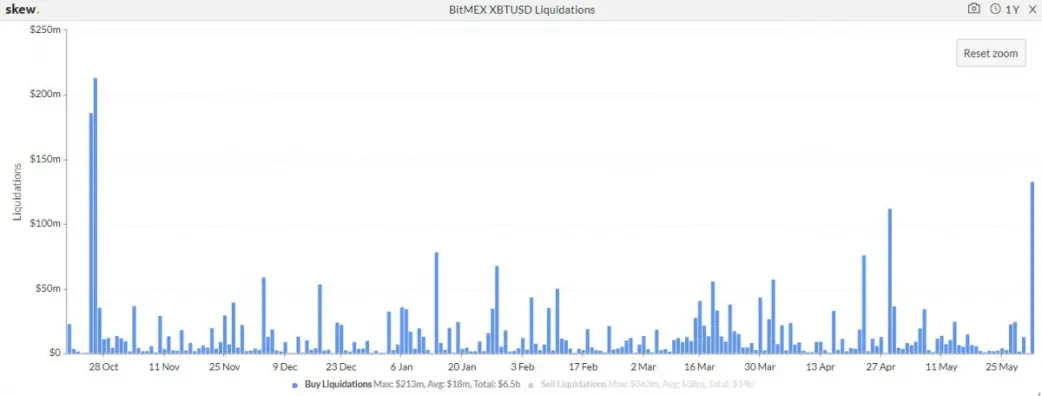
In summary, they bring in this study that the number of settlements on the positions that were sold on the market was the highest in the last 8 months and the repurchase of those positions (which reached 133 million) caused the price to rise to $10,500 and fall on the day following the $10,000 break with the reentry of these people in short positions. As I said in a previous study, the $10,000 and $8,000 zones had a LOT of stop orders so the break operation would be more effective, but care should be taken in breaking both areas for the same reason.
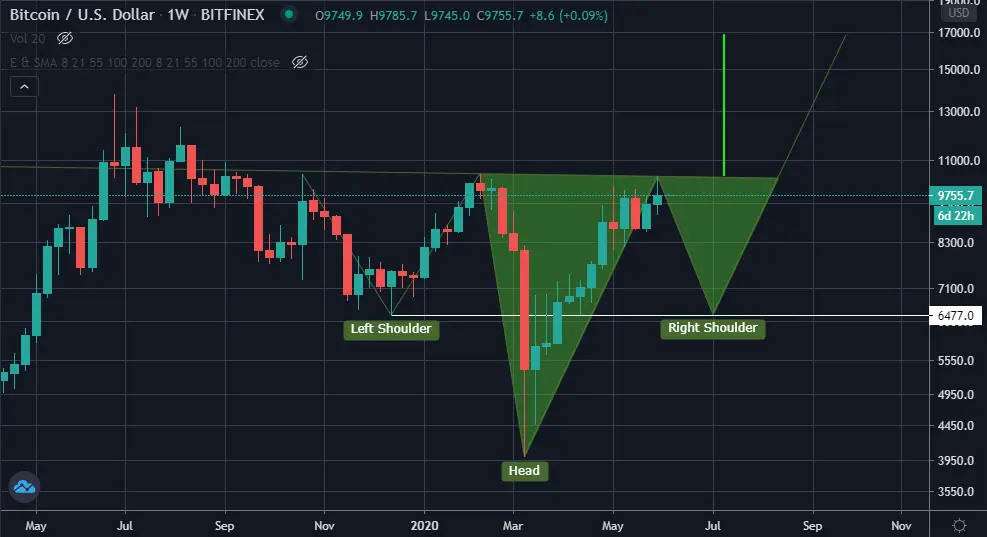
Starting on the weekly chart we have the possible formation of an upside-down shoulder-head-shoulder in formation which is a bullish figure that would break us to something around $17,000, but for this possibility if we confirm we would have to see the price retreating to the $6,500 zone before going back up and pushing hard.
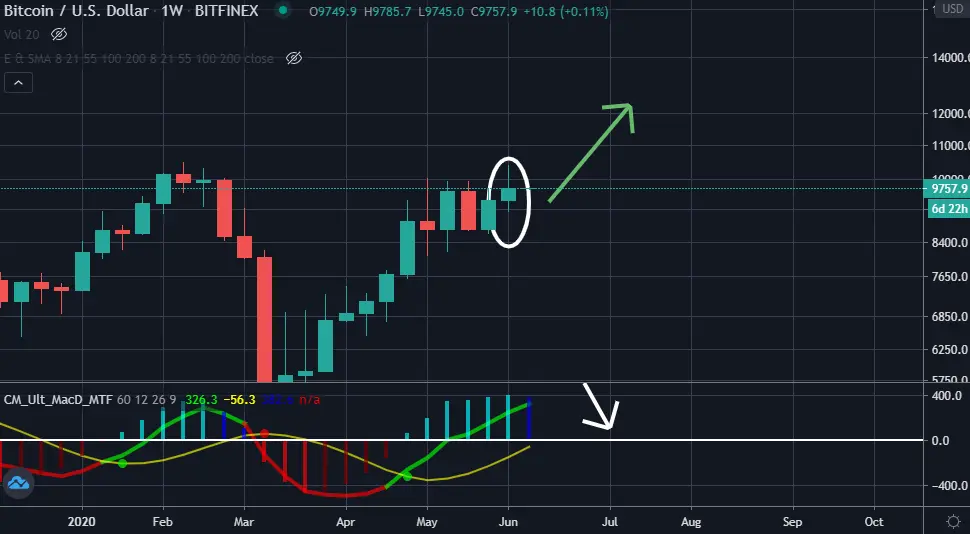
Despite this possible formation of a head to shoulder we have the weekly candle forming a candlestick pattern called spinning top (indicating a balance between buyers/sellers, but with great price fluctuation) showing the possibility of continuity in the trend, which diverges with the MACD which indicates loss of buying power.
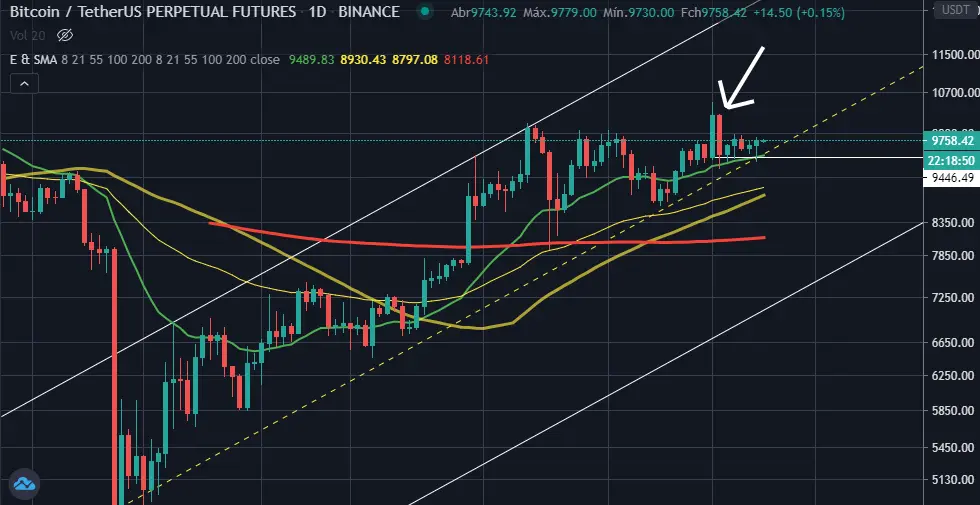
On the daily chart we have that channel plotted in my last study is still valid, there was a test yesterday followed by a rejection in the channel's median line that coincides with the exponential moving average of 21 periods. Looking at the rupture candle of day 1 we see that it was not strong enough to touch the top of the channel (which may indicate loss of buying power) and observing the falling candle of day 2 we have to close it and the following days closed above the opening of the candle that was above $10,000, which does not detract from the upward trend. The most important point to think about in this price region we are in is the resistance we have above, so we may not have missed the upward trend but the large accumulation of resistance above may characterize an even greater price dump.
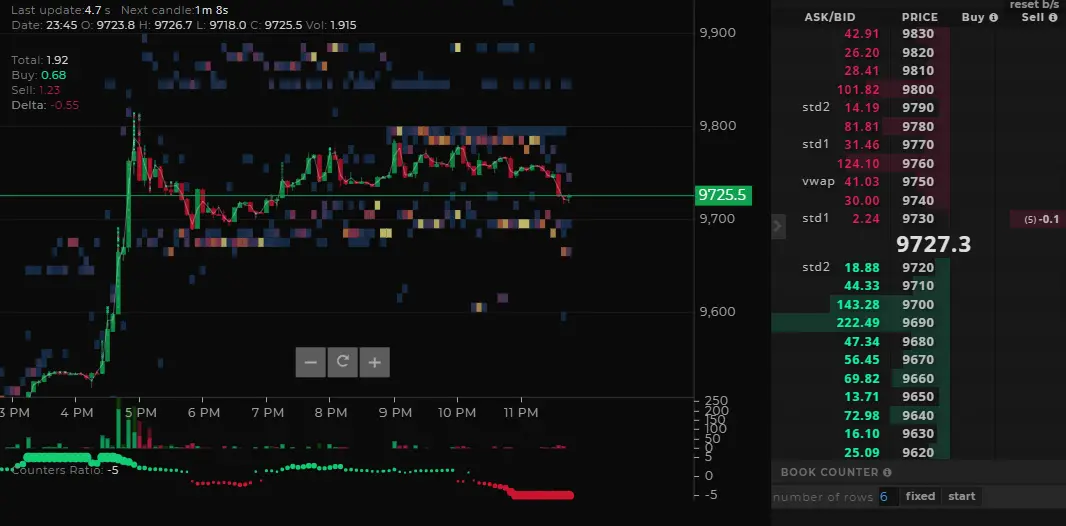
To start the analysis of market sentiment I will use Tensor Charts, if you are not familiar with this tool, it is a website that shows in real time the orders book of offers on the bitcoin graph, then we have the graph of the price followed of a series of points, the clearer the point the greater the concentration of orders in that area, if at any time it had a very strong point and then disappeared it means that the order was removed from the book. At the moment where we had that small drop we have more orders below than above, looking on the right we have that in $9690 there is an order of 222 bitcoins and the maximum selling pressure seen is 124 bitcoins, analyzing superficially, in case there was a rapid movement of buying for a whale the price could have a pump in the price bringing a herd effect.
Generally, I use the Tensor charts to identify the order of the whales and to position myself strategically because what usually happens is the manipulation towards that order to generate liquidity followed by an opposite movement. Example: Let's say that bitcoin is at $100, the whale places an order at $90 and the price tends to go up to that price giving the false illusion that it will continue to fall and then bring a high bringing the price to $110
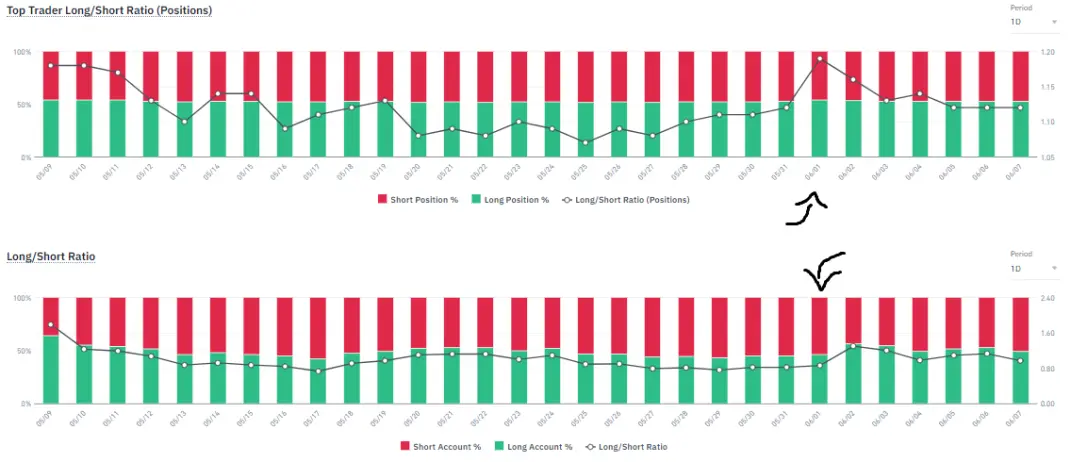
Binance provides a graph showing the average position of the 20% highest volumes traded on the futures platform and of the market positions in general, usually at decision times like the one on June 1 the positions are quite different, the biggest traders were selling and occasional traders buying, the ideal thing to do here is to follow whale orders. This binance indicator is very effective if you are doing day trade. In the last 3 days they are very similar to about 52% of purchase and 48% of sale, showing indecision, but the biggest orders according to the daily tensor charts are 200 bitcoins (which for a whale is little), which I do in moments like this is to stay out of the market
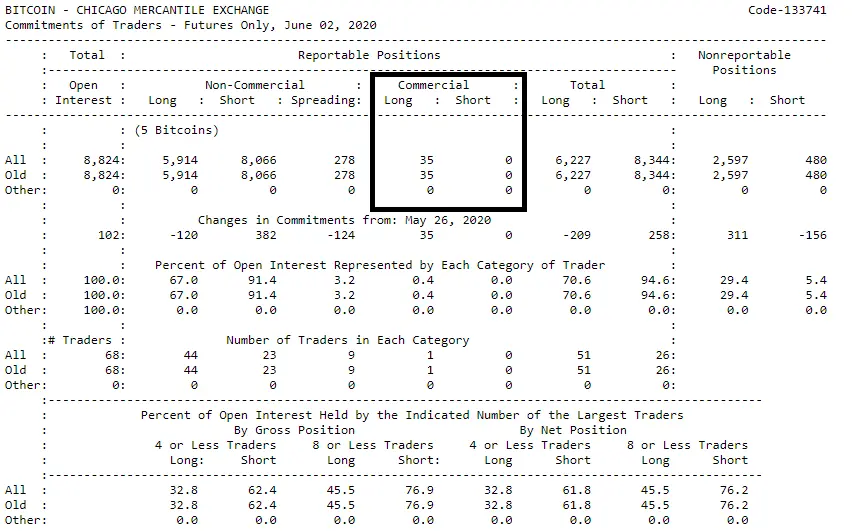
To finish I bring the CME report showing the position of institutional traders, here we have that banks went long in bitcoin before day 2 (by pure logic they entered day 2 since it was the day when the price dropped). Last month we had the same number of orders at the beginning of the month and they left the position around the 15th, if the trade of this institution is repeated we would have their entry between $9264 and $9514 (making these zones as a very strong resistance until the day 15 and the possibility of another candlestick going up to the $10,200 zone for them to close their profit positions (after all, banks rarely come out in a loss).
I hope you enjoyed my study, thanks for reading :D






