Hello All,
In my last update I expected another down leg, it did play out, but the down leg turned out to be a mini flash crash event. The triangle for wave "Y" idea is no longer an option, the failure of that potential probably triggered a lot of stop losses.
A triangle in the Y-position is pretty rare, I've seen it play out but mostly on smaller time frames and before a powerful third wave. It means we have to switch to a new idea for the big picture.
But the recent price action does not change that much really, I am pretty convenient in what I have counted since the September high, only three wave structures :
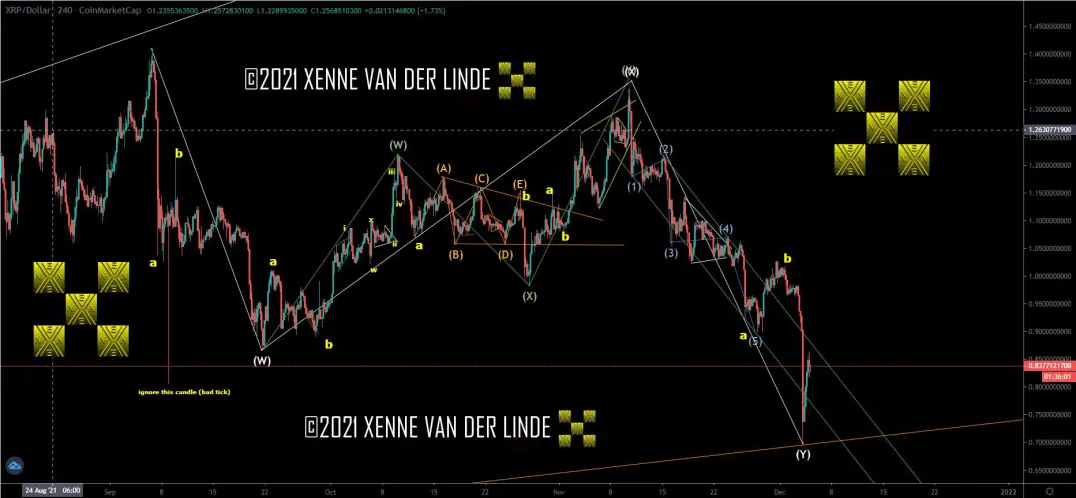
The second set of three is a combination (WXY) but it did not retrace 90% so it does not qualify as a flat wave, so another set of three was expected at that point. We got a nice bounce from the recent bottom, that probably confirms that "Y" has completed. Additionally there could be another zigzag lower though, but I am not expecting it, but it remains possible.
So how does this "WXY" fit in the bigger picture? There is more then one possibility. But the idea was that we were in a big "X" wave, and that idea remains my primary idea. That X wave can be a big triangle in progress with the recent bottom as that c wave in that triangle, this would mean we would need some more time to finish that triangle structure . But based on what I see in other markets this is not my primary count.
My primary idea is now as follows :
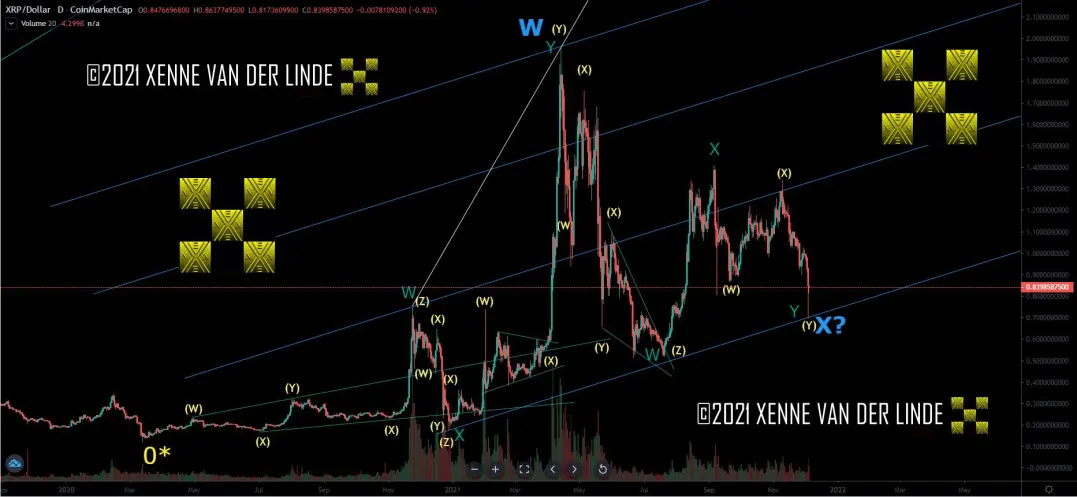
As you can see my primary idea is that we have a "WXY" (green degree) complete at this point, it took 234 days to play out and it forms the X of larger (blue) degree. As of now it is a running type of correction because the Y ends above the W. I am not showing alternative ideas for clarity. But another count that came back in play is that of an expanding diagonal, this is because we got a new overlap of the November 2020 high. So this "WXY" can also work as a "4" in that expanding diagonal structure, this is not the primary idea however because a diagonal most of time consist of simple zigzag structures and not combinations, but good to keep in mind the potential. I did draw a white line connecting the potential 1st & 3rd wave.
Needless to say that the XRP count is very complex, we are dealing with zigzags on 3 different degree levels. From low to high : Yellow degree, Green degree and Blue degree. I am now assuming that the X of the blue degree completed as a running WXY, if correct we should now see an Y wave of that same degree, this wave could be the euphoric end of a bubble. We are early in this bubble, yes - early in price, but in time this bubble is more then 600 days old, so all we miss is maybe an euphoric price spike. Hopefully now is that moment for XRP, but be aware of a sudden collapse when complete.
So the reason for my message today is that I am going to try count upward from the recent bottom and see if it's working. What I am expecting for Y is a zigzag, a double or a triple zigzag. So yeah, it remains very complex and it's going to be very difficult to call the exact top of this wave if it plays out. When one zigzag completes it is going to be a potential top, but could be followed by additional upside. Also there could be another X of blue degree followed by a Z. But that are worries for later.
Let me finish this post with a look at the recent price action since the low, it looks like five waves up from the low. It's very early to say, but I can see upward potential. Will focus more on recent price action when we have some more data.
But that is it for now, I realize this post is pretty complex and I apologize for that reason.
Hopefully my attempt to count upward will work in the coming days & weeks. Stay tuned!
Yrs,







