
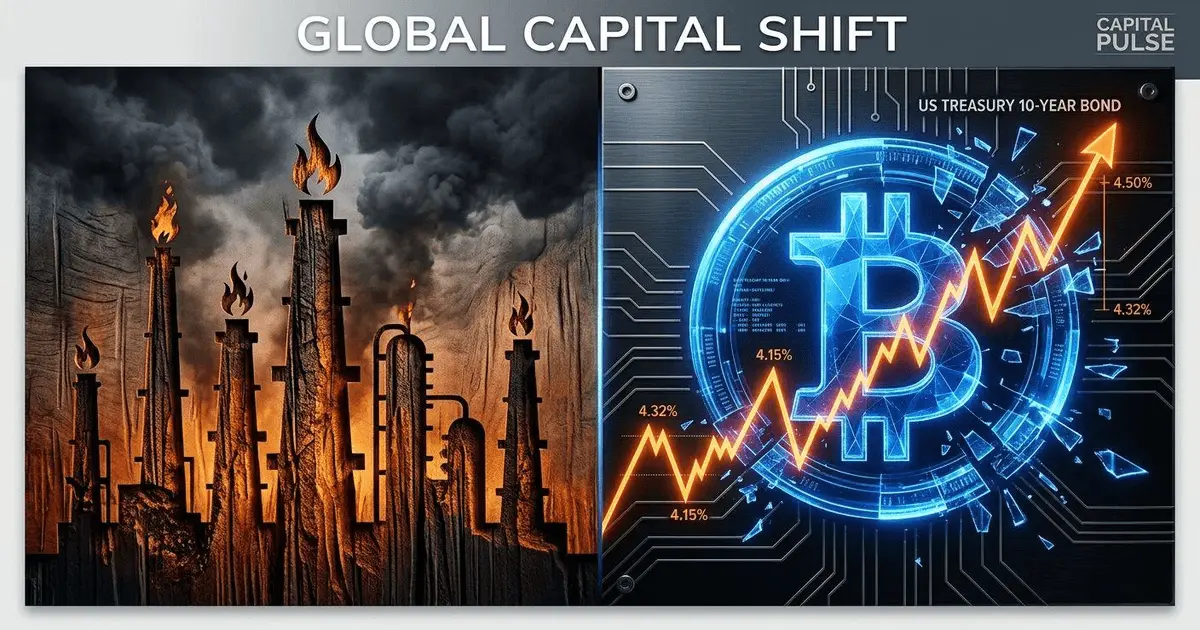
The macro shift Rising geopolitical risks in the energy sector coincide with a multi-month high in US Treasury yields, pulling capital away from crypto.
The cryptocurrency market has just served a brutal reminder that it does not operate in a vacuum. After flirting with the psychological resistance of $82,000 and giving bulls hope of a clean breakout, Bitcoin faced a sharp reversal, crashing straight through critical support levels to hit a multi-week low near $76,500. This wasn’t just a random technical correction. It was a perfectly synchronized storm engineered by deteriorating geopolitical conditions, surging macroeconomic risk, and a highly leveraged derivative market that got caught off guard. Within a matter of hours, over $580 million in leveraged positions were completely vaporized.
Let’s tear down the fundamental catalysts behind this sudden crash and dive deep into the technical charts to answer the burning question: Will the $74,000 support hold, or are we heading toward a deeper macro correction?
1. The Trigger: Trump’s Truth Social Statement and Geopolitical Anxiety
The immediate catalyst that broke the market's back came from a sudden escalation in the Middle East. Over the weekend, President Donald Trump took to Truth Social, posting a stern warning stating that for Iran, "the Clock is Ticking, and they better get moving, FAST" regarding stalled ceasefire negotiations.
The impact on global markets was instantaneous:
-
Energy Shock: Brent crude futures immediately spiked by nearly 2% to $111.42 per barrel, while WTI cleared $107. With global energy infrastructure in the Persian Gulf reporting minor strikes and the Strait of Hormuz remaining highly volatile, fears of a full-scale supply disruption renewed overnight.
-
Risk-Off Migration: When geopolitical tensions flare, institutional capital shifts away from non-yielding or highly volatile risk assets. Money managers moved aggressively out of equities and crypto, shifting instead into defensive safe havens like the US Dollar and physical gold.
2. The Macro Backdrop: Bond Yields and the $1 Billion ETF Outflow
While geopolitical headlines caused the sudden panic, the underlying dry tinder was laid by a hostile macroeconomic environment.
The 10-Year Treasury Yield Surge
Persistent inflationary data (manifested through back-to-back hot CPI and PPI prints) has forced the market to drastically reprice the Federal Reserve’s interest rate policy. The market is realizing that rate cuts are getting pushed further into the future.
Consequently, the 10-year US Treasury yield shot up to 4.63%, its highest level in 12 months. When risk-free government bonds offer yields close to 5%, the opportunity cost of holding volatile digital assets like Bitcoin increases significantly.
Institutional Capital Flight
This macroeconomic strain was clearly visible in the institutional desks. After a solid multi-week streak of inflows, US-listed spot Bitcoin ETFs recorded a staggering weekly outflow of over $1 billion. BlackRock’s Ethereum ETF (ETHA) and various Bitcoin funds saw massive liquidations as institutions temporarily de-risked their portfolios to preserve cash.

Over $580 million vanished in minutes as automated liquidation cascades forced a vertical price drop.
3. The Cascading Effect: Inside the $580 Million Long Flush
When the spot market began to dip on Trump's comments, the real damage was done in the futures market. Bullish traders had heavily leveraged their accounts near the $80,000–$81,000 range, anticipating an upward continuation. According to data compiled from Coinglass, a jaw-dropping $581 million in digital asset positions were liquidated within a 24-hour window.
The mechanics of this crash provide a vital lesson in market dynamics:
-
Long Liquidations: Out of the $581 million flushed, over 95% ($552 million) consisted of leveraged long positions.
-
The Dominos Fall: Bitcoin led the individual asset bloodbath with $189 million in forced liquidations, followed closely by Ethereum at $151 million.
-
The Trigger Point: The single largest automated liquidation order occurred on the Bitget exchange, where a single $21.59 million BTCUSDT position was forcibly closed by the system. This forced selling triggers a domino effect liquidations lead to lower prices, which trigger more liquidations, creating a vertical drop.
4. Technical Angle: Will $74,000 Hold or is a Deeper Drop Imminent?
Turning to the daily and weekly charts, Bitcoin’s price structure is currently resting at a highly critical inflection point.
Immediate Support and Resistance Structures
Bitcoin is currently trading below the 50% Fibonacci retracement level of its recent macro swing, which sits around $78,962. This level has now flipped into immediate overhead resistance. For the bulls to reclaim any short-term momentum, a daily close above the 61.8% Fibonacci level at $83,437 is mandatory.
On the downside, the key battleground is the $74,000-$75,000 support cluster. This zone is incredibly vital because:
-
It aligns with the intermediate-term Exponential Moving Averages (EMAs).
-
It represents the old local resistance structure formed during the early Q2 consolidation phase before the rally toward $82,000.
The Two Probable Scenarios
-
Scenario A (The Bullish Defense): If Bitcoin can consolidate between $75,000 and $76,500, allowing the RSI (Relative Strength Index) to reset from its current oversold conditions on smaller timeframes, this drop will be classified as a textbook "liquidity hunt." A clean bounce off the $74,000 structural support would validate a healthy macro higher-low, opening the path back to $80,000 once geopolitical tensions cool down.
-
Scenario B (The Bearish Breakdown): If macro pressures intensify and the 10-year yield breaks above 4.70%, a daily close below $74,000 will invalidate the current intermediate bullish structure. If this level fails, the next major historical liquidity pocket rests at the $68,950 region, protecting the ultimate macro swing low near $61,000.
Conclusion & Educational Takeaway
This market shakeout proves that no matter how bullish an on-chain structure looks, global macro liquidity and geopolitical realities will always dictate short-term price action. For retail investors, the lesson is clear: trading with high leverage during sensitive geopolitical standoffs is an open invitation to a margin call.
Keep a close eye on the $74,000 support zone and the 10-year Treasury yields over the next few daily closes. Volatility is far from over.
Verified Research Sources & Data References:
-
Derivative Liquidation Data: Coinglass Crypto Derivatives Dashboard (May 16-18, 2026 Reports).
-
Macroeconomic Yields & Energy Quotes: FinanceMagnates Financial Intelligence Division, Bloomberg Terminal Energy Metrics (Brent Crude Pricing Archive).
-
ETF Flow Trackers: BitMEX Research & FxStreet Institutional Outflow Trackers (Weekly Spot Bitcoin ETF Flow Database).
-
Geopolitical Monitoring: President Trump’s Official Truth Social Verified Stream & U.S. Situation Room Media Briefings.
Disclaimer: This post is for educational and research purposes only and does not constitute financial advice. Always do your own research (DYOR).






