
Bitcoin has shown in recent weeks to be more than a digital asset, a reservoir of value for many investors, and for skeptics, just take a look at the significant migration to volumes of official derivatives on Wall Street in futures. of Bitcoin once the devaluation of the dollar was known at 1.5 percentage points this week.

In addition to using Gold as a regular strategic reserve, products based on cryptocurrencies and especially Bitcoin, had a significant influx of institutional investors seeking to recover losses due to the fall of the US currency.
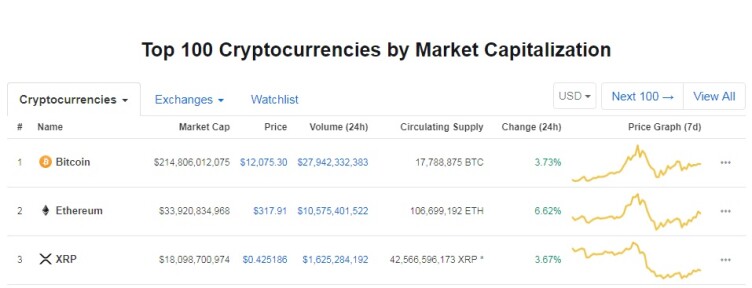
In general, the crypto market has been on the rise, with strong volumes of more than 100 billion dollars a day and a MarketCap of more than 330 billion dollars, where the leading cryptocurrency maintains the domain quota well above 60 percent.
Bitcoin is once again repeating patterns that have already occurred in the past. We are currently in a phase of unloading where the price begins to lean within the historically projected trend line that provides for a long term price for the cryptocurrency king of up to 100k as many have predicted in other opportunities and given the generalized FOMO by news of Facebook and despite attempts to discredit and control by regulatory bodies, the truth is that the trend seems irreversible in the medium term as the halving approaches.
Gone are the stages of enthusiasm, new paradigm that bitcoin proclaimed media attention and capitulation to usher in a new era of consolidation where demand will grow as supply is reduced, so that exponential growth is evident.
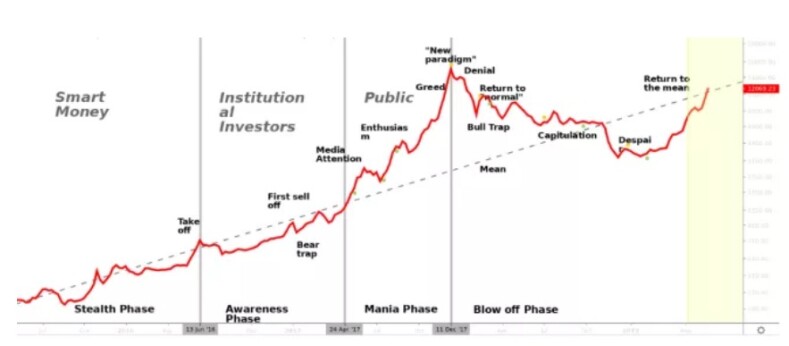
If we look at the price patterns of BTC since its public exposure in the exchanges, we see that we are in the third cyclic wave, as has been described by the popular trader FlibFlib in the networks and which we will focus on analyzing if indeed we can see an average price this year around 14k.
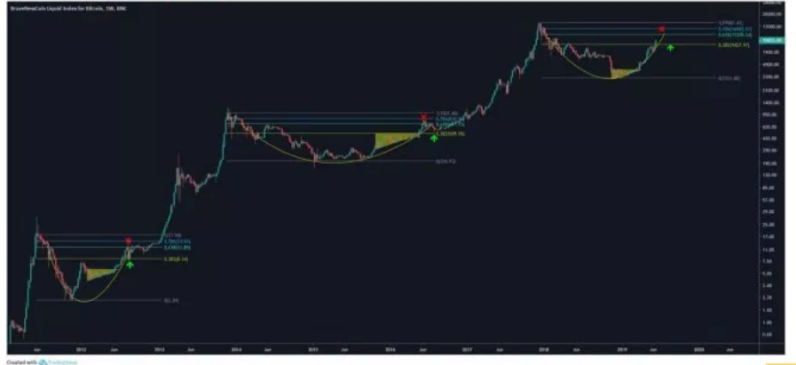
Mike Novogratz gave us his impression recently and you can verify it in our respective post, about his band of prices for BTC in the rest of the year and apparently it coincides with the presented by the previous graphic, where the third ascending parabola foresees a cut with medium-term Fibonacci levels around $ 13,305 by the end of this month and a maximum of $ 19,581 by the end of 2019.
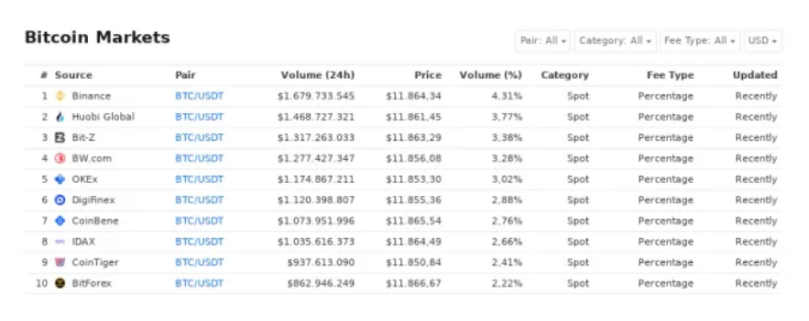
On June 28, BTC presented a price recovery, and still remains positive with respect to the cut of the last 24 hours. Its spot price is $ 12075.30 and this represents an increase in the percentage with respect to the last intraday cut. Its daily volume is 38 trillion dollars and its market capitalization increases more and more as its price increases.
After reaching its historic high of the year for now around 13,800 this June 26, its price fell to levels close to 10,800 (key support) for a desperate attempt by bears to bring BTC back to four-digit levels again..
In the short term 1h of BTC presents an encouraging and quite interesting scenario. After reaching its historic high of the year for now around 13,800 this June 26, its price has fallen to levels close to 10,800 (key support) for a desperate attempt by the bears to bring BTC to four-digit levels again .
However, its recovery has been satisfactory and for now we are seeing that its price is meeting the second wave of Elliot projected to levels of up to 12,649 (point C) for this weekend as long as BTC manages to finish breaking the immediate resistance to levels of 12k.
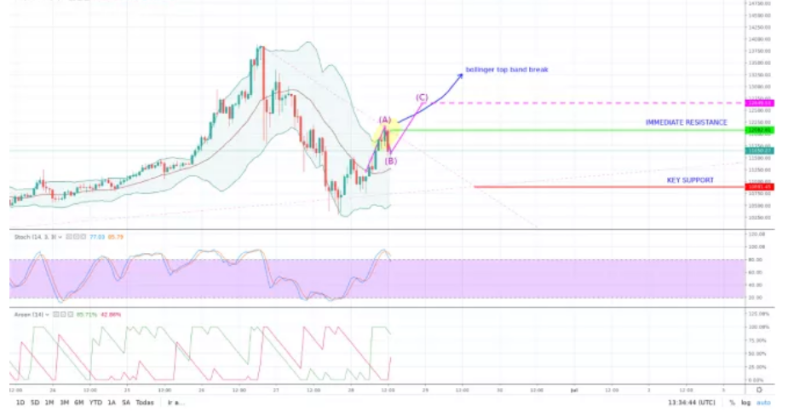
The Bollinger Bands present a less volatile cloud and the last candles have managed to show the possibility of breaking the upper band and is expected for the ideal entry of an upward rally.
Aroon is bullish with its UpTrend indicator in the highest part of the chart despite the corrective moment of the asset.
Stochastic has started to leave the overbought zone and starts being in the ideal entry zone for many investors.
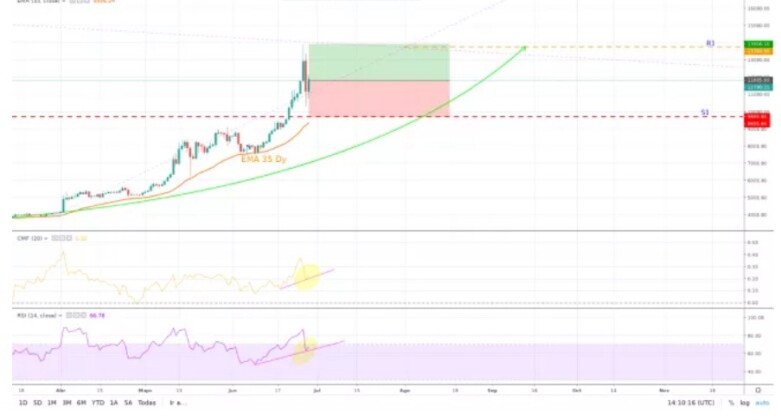
In the medium term, the cryptocurrency has its ascending parabola as we have already mentioned, and a projection that approaches SOLID by mid-September close to 14k.
The key support band is below ten thousand as we can see in the long strategy and an immediate resistance already mentioned of 13,916.16 dollars per unit.
Its average exponential value at 35 days is the key support point of this ascending parabola that Bitcoin currently has.
CMF tells us that the capital inflow is still positive despite the bearish momentum and its positive slope projects new highs.
RSI for its part already begins to indicate the pressure of strong purchase of the asset in the medium term, with positions increasingly open to levels of 14k that project an entry to the overbought area with RSI greater than 70.
Bitcoin has always surprised us and promises to stabilize for now at a price of levels in the order of 13 thousand per unit before making the big jump to expected maximums of this year exceeding 20k, we just have to look forward to this new crucial stage of this active crypto that breaks new paradigms this year 2019.


