
According to one technical fractal, Bitcoin could reach $ 20,000 by the end of this year.

Currently, the leading cryptocurrency is being traded inside the upward price channel, which is represented by a series of higher highs and lows. Periodically, the BTC course bounces off the bottom line (channel support level) and focuses on the top trend line, which represents resistance.
Similarly, after testing the upper line, the BTC course is adjusted to the support level. While trading takes place inside the upward channel, the nature of the trend remains bullish. After this usually follows a breakthrough in the direction of the previous movement. Since Bitcoin rose before this corridor began to form, the likelihood of a bullish breakout is rated higher.
Pattern with upward channels on the BTC / USD chart
A similar trend was observed in 2019. As shown in the chart above, the bearish period ended in December 2018. Then the price rose steadily within the rising channel before the breakthrough on April 2, 2019, during which the price jumped from $ 4132 to $ 5121.
This led to a price rally, which peaked around $ 14,000 in June 2019. During this take-off, two more upward price channels appeared on the chart, the formation of each of which ended with a strong breakthrough.
Bullish BTC fractal repeats
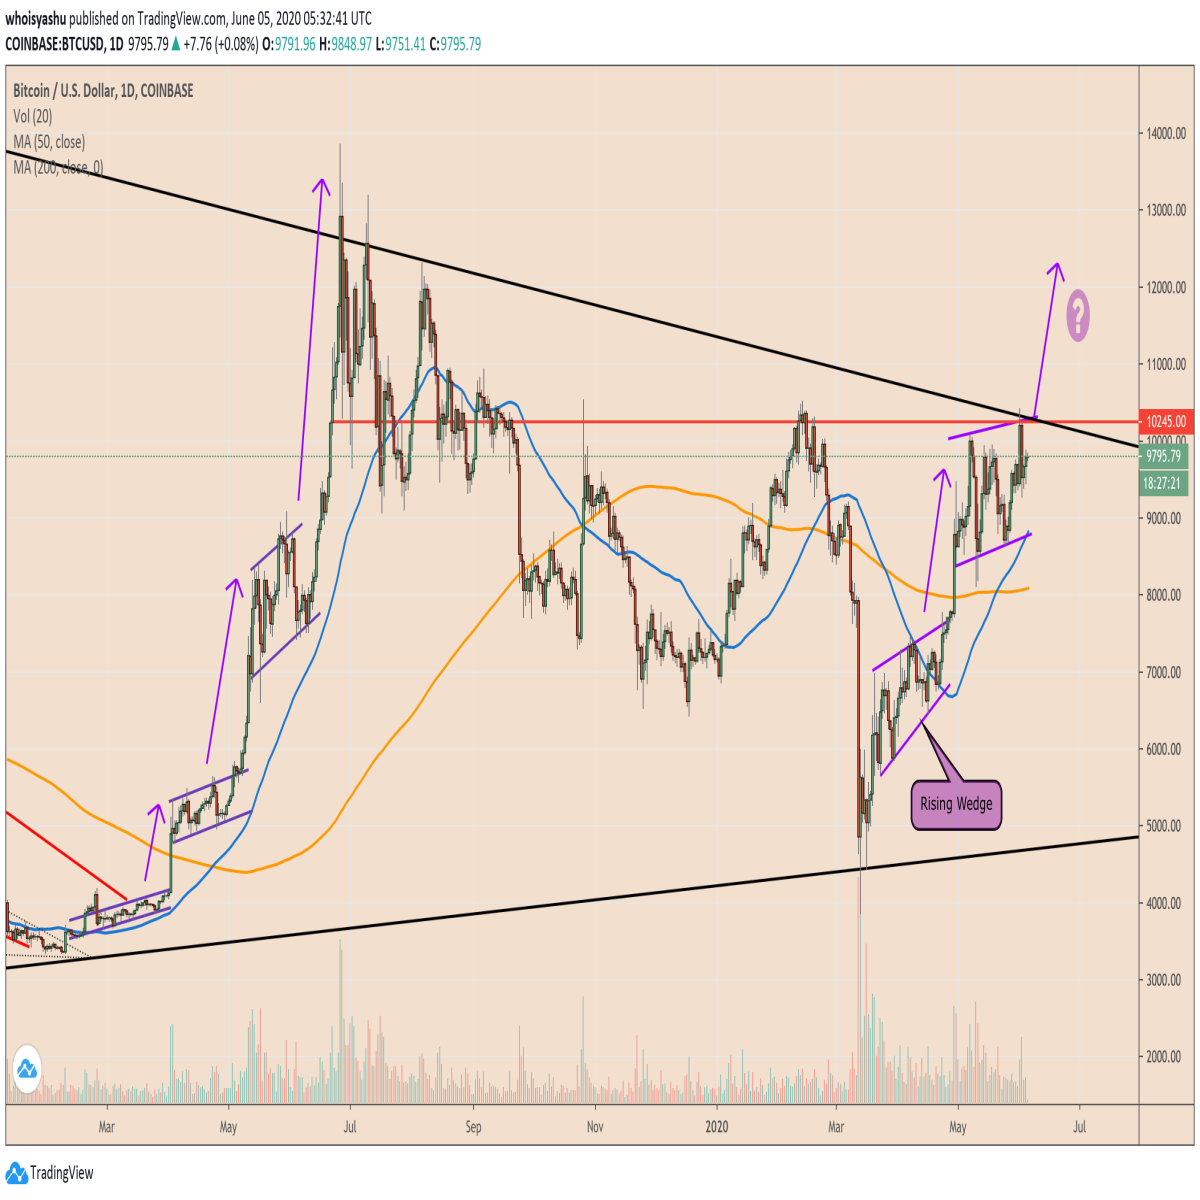
In 2020, Bitcoin repeats this fractal. The reversal occurred after falling to annual lows below $ 4000. Then the asset was traded in an upward wedge pattern, which is technically bearish. However, the bulls annulled him.
In the end, the price overcame the psychological mark of $ 10,000, after which it was adjusted to support levels in the 8-thousandth range. There were several similar attempts: the price rose and reached higher highs and more lows, and as a result of the last impulse, a local maximum of $ 10,500 was almost reached. These fluctuations represent an upward price channel.
Golden cross reinforces bull position
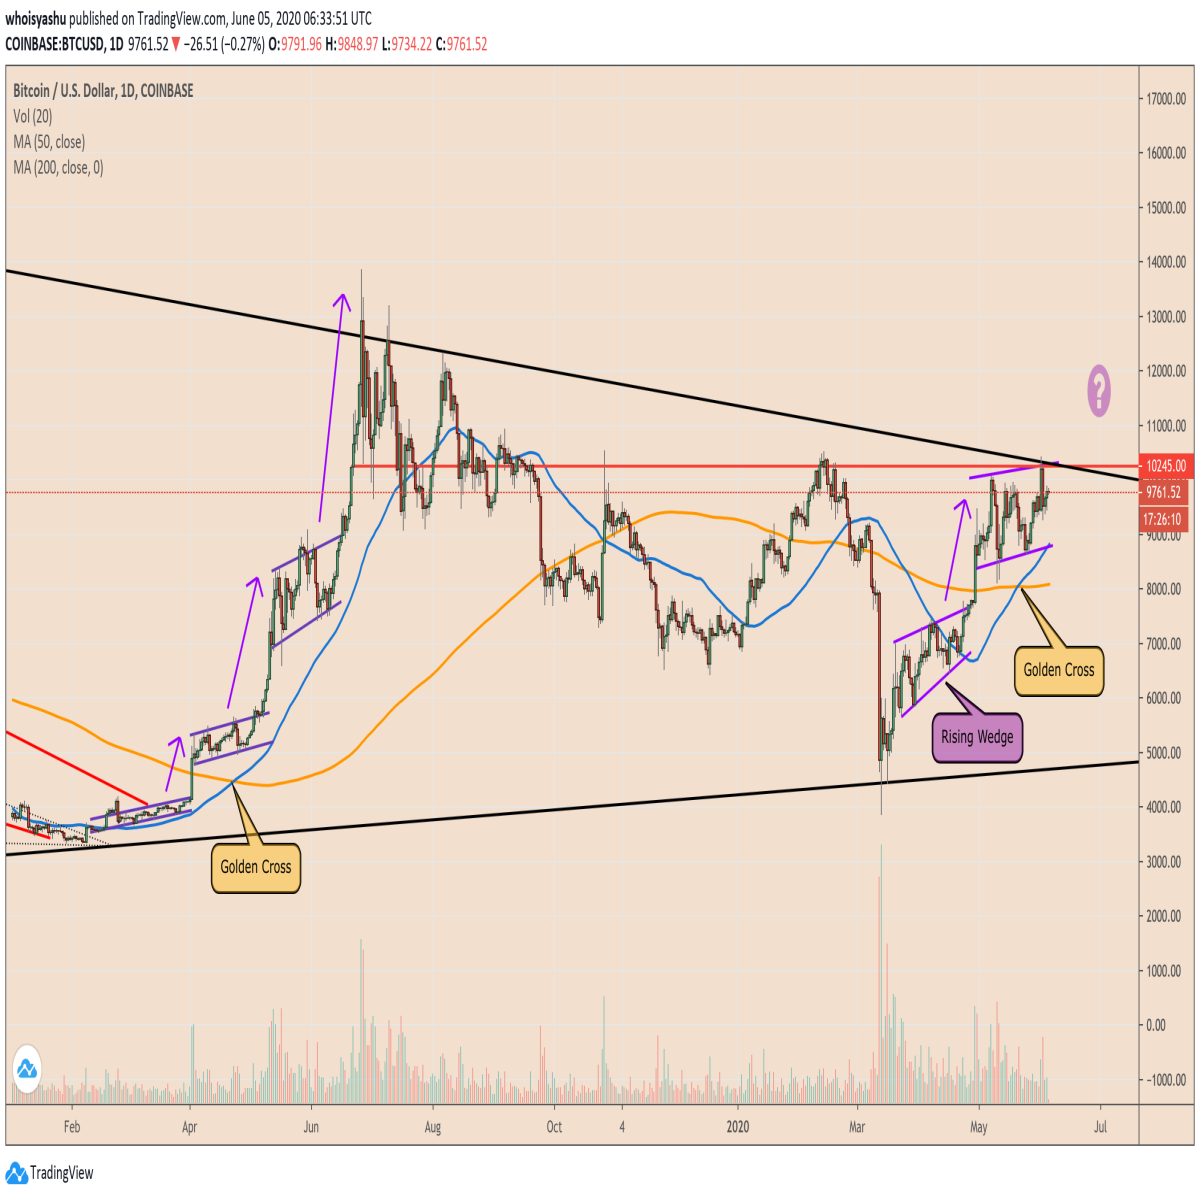
During this growth, a golden cross was formed on the chart - a technical indicator that occurs when a short-term moving average of an asset (in this case, a blue 50-day MA) crosses a long-term moving average (an orange 200-day MA).
The same golden cross was noted during the 2019 rally. Moreover, it was confirmed right at the same time point of the fractal development, when the ascending channel was formed. Thus, the current scenario may repeat the bullish fractal of 2019.
Why is Bitcoin targeting $ 20,000?
The previous fractal with a number of ascending channels and a golden cross helped the asset grow by more than 150%. That rally was supported by macro factors such as the fall of the renminbi, the launch of Facebook's Libra and the aggravation of trade relations between the United States and China.
Now Bitcoin can repeat a 150 percent leap due to fundamental and technical factors. The yuan again risks falling due to increased geopolitical tensions between the United States and China, and quantitative easing programs for central banks around the world create the conditions for confirming Bitcoin's status as an ideal safe asset. In a recent Bloomberg report, analysts noted:
Bitcoin ended 2019 at around $ 7,000 - near the lower end of the range. This contributes to a reversal to its upper level. Last year, the maximum was about $ 14,000, and in 2020 it can almost double if we consider the new channel.


