
Low and behold!
It has been updated at last.
The Historical Monthly Chart for Bitcoin
E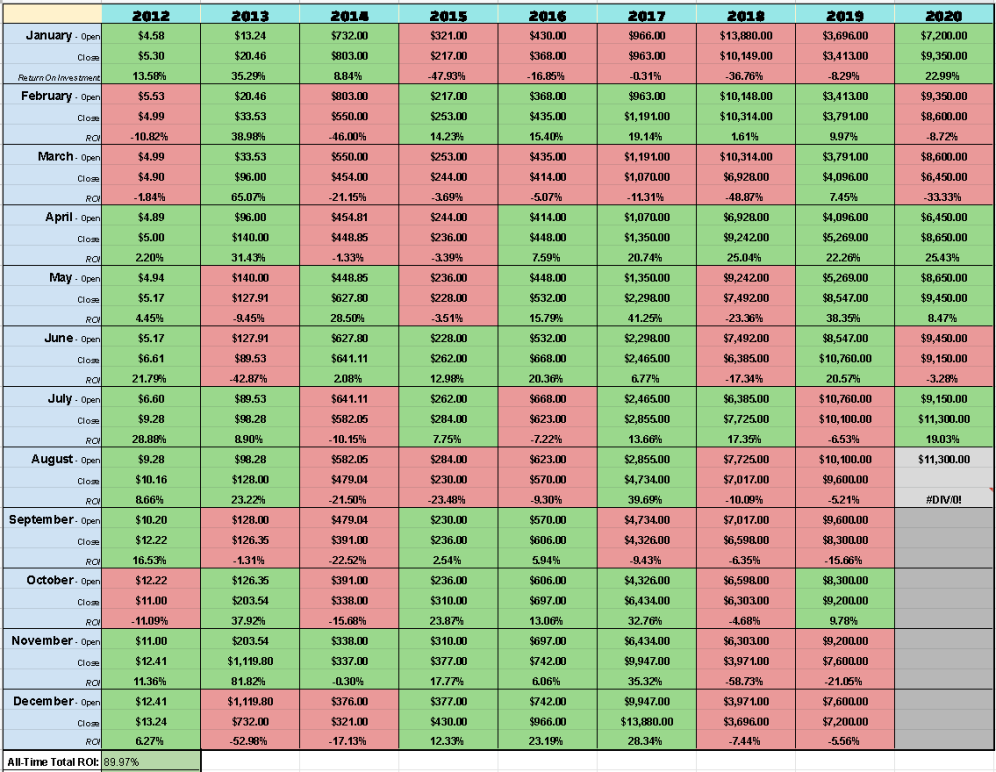
(chart source: created in Excel using data from CoinMarketCap)
What is the Historical Monthly Chart for Bitcoin?
The Historical Monthly Chart for Bitcoin displays the monthly Open and Close prices for Bitcoin starting from 2012 leading up to August 2020.
The chart displays an ROI or Return on Investment which is determined by comparing the Open and Close for the month.
The Open and Close are determined by the 1st day of each month after checking CoinMarketCap's Historical Data Tables.
Green represents a month that closed positively.
Red represents a month that closed negatively.
Closing negatively or positively does not mean the month performed terribly or really well.
That is because this data takes into account only the monthly Open and Close prices of Bitcoin.
It does not take into account the Highs and Lows for each month.
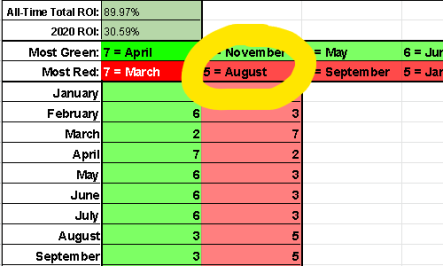
Additional Info:
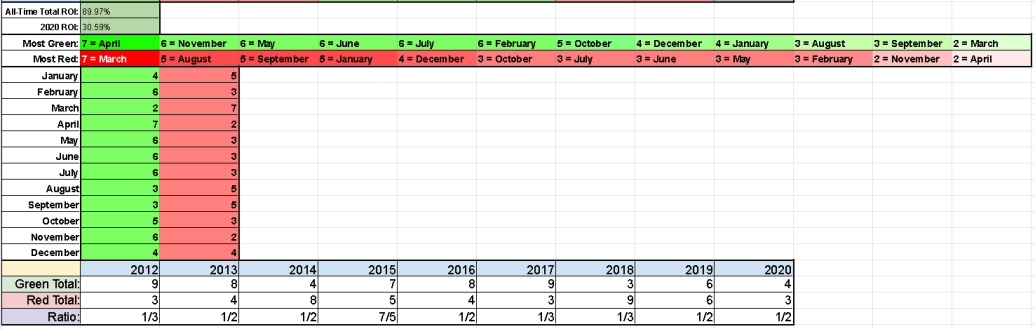
(image source: created using Excel and the prior chart in this article)
Top 3 Green Months:
1. April
2. November
3. May
Top 3 Red Months:
1. March
2. August
3. September
August Update:
August has Opened at $11.3k
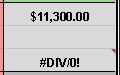
Bitcoin must Close greater than $11.3k for August to end positively

Bitcoin might Close less than $11.3k for August to end negatively
Based on Bitcoin's Historical Monthly Chart the month of August is primarily Red
That means August tends to have a price that closes below what it opened at
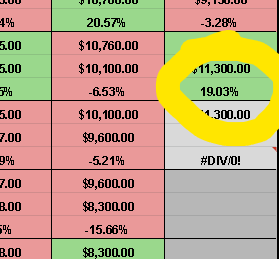
The ROI for July was 19.03% which is extremely impressive
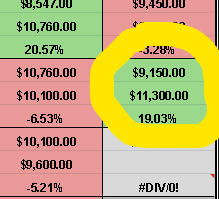
July Opened on the 1st at a fairly high price of $9.1k
By July 31st the price jumped even higher and Closed around $11.3k
Conclusion:
July performed very well!
Last month if you were lucky enough to purchase Bitcoin at the Opening price or better.
You might be heading into August feeling mighty fine!
July sentiment was mostly split 50/50 with which direction Bitcoin would head by August 1st.
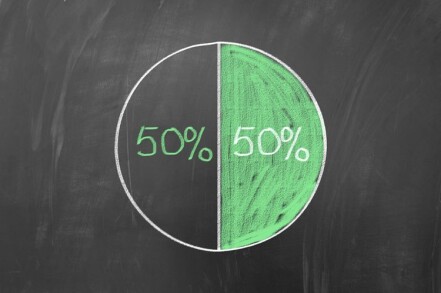
However, July sentiment also had everyone agreeing 100% that it was a bad time to both Buy or Sell.
Well.
That was then!
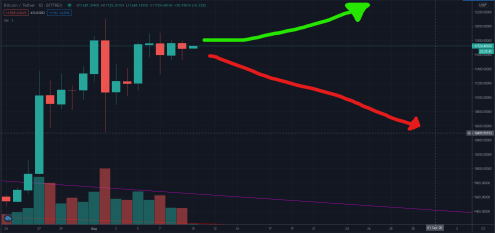
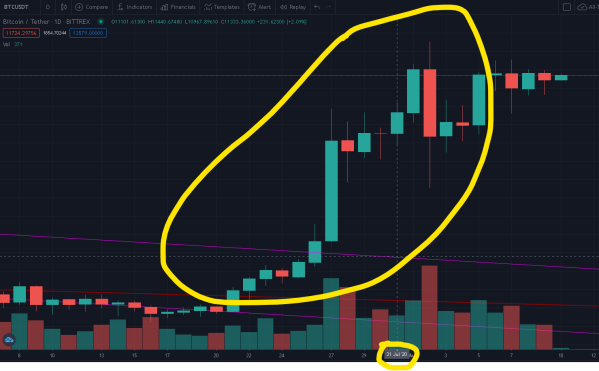
This is now, and right now is probably more intense than before!
Some of us might be taking a big deep breath from the totally tubular price surge we just rode to $11.3k.
Nice ride waving, "dude!"

However, at any given moment the price could violently plunge by $1k to $3k.
Then it could stay there.
A plunge down $3k from $11k would put us right around the good ol' days of $8k.
That plunge could stay and it could carry over into September.
For now, in August, the sentiment feels slightly different and on the upside.
The TA shows Bullish, the Experts tend to say this "might" be Bullish.

Bitcoin's Historical Monthly Chart shows a trend that looks Bearish for the month of August.
Others looking at this may disagree and argue that August is going to be Bullish and end positively!
It doesn't matter either way for me but if I had to choose where August ends my guess is as good as yours.
My guess would be that Bitcoin ends negatively according to the Historical Data Chart.
Bitcoin has been really slowly leading up to this point which leads me to believe that it will stay steady for now.
Bitcoin might stay steady until September and then September will Open with another hair-pulling month.

A negative ending to August wouldn't be bad unless is closes at like $8k or $7k and below.
My guess is that August Closes and September Opens at $10.5k.
That puts the price of Bitcoin historically below its opening for August in the negative.
Then on the other hand it puts the price of Bitcoin above what it was when opened in July.
Going into September with an Open of $10.5k sounds about right to me but of course there is no way of knowing.
So don't hodl me to it 😆

We could end in the negative at $11.2k
or
We could end in the positive at $11.4k
or
We could end in the super positive at $20k
There are endless possibilities!
The Bitcoin Historical Chart is updated every month so lookout for the next one in September
I am always happy to answer questions in the comments if help is needed
Thank you very much for reading and be safe trading hodlers!


