
We are just barely 4 months into 2020 and it has already been a wild first quarter all the way through!
With only 2 months away before the first half of the year is reached. It might be a good time to look at some historical data on Bitcoin.
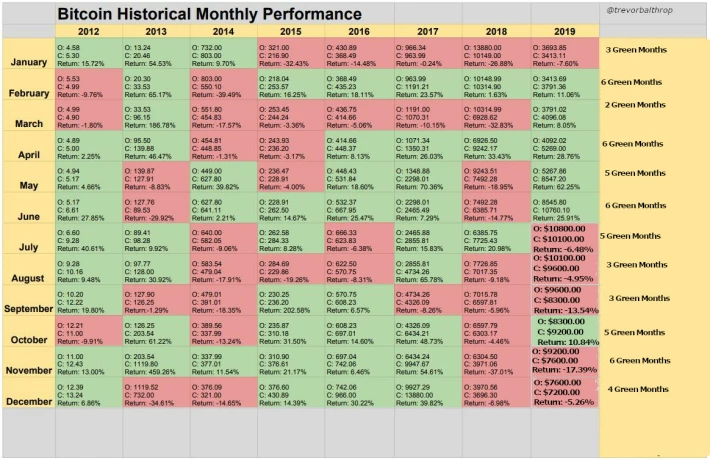
This image you see above was first created on Twitter back in June 2019.
The rest of the information was filled out by me now that the numbers are in.
What does this chart tell us?
This chart shows us every month of every year between 2012 and 2019 and tells us roughly how each month performed.
Soon I will be working on one that involves which months are most volatile, but since that isn't the greatest prediction tool I will exclude it for now.
Now since this chart above tells us "and" shows us visually how each month compares.
Someone can start to plan ahead and draw conclusions based on current facts and historical performance.
Sort of like an Almanac for Weathermen!
#dailyhodlforecast
What months perform the best then?
Well according to these numbers there are about four or five months that have been pretty solid for investors.
Those months would be the months that all had 6 positive outcomes since 2012 which were:
Months with 6 Positives:
- February
- April
- June
- November
Months with 5 Positives:
- May
- July
- October
Months with 4 Positives:
- December
Months with 3 Positives:
- January
- August
- September
Months with 2 Positives:
- March
This helps break things down for us to start with a framework around how we will be investing.
Looking at which months are positive and which months are negative will help us better reach a decision in the future!
When there is a month I feel Bitcoin is going to be a negative month and price goes down. I will be more alert to my options.
For example, a month I feel bitcoin goes down, I can have funds ready to buy low.
In the same example, I can also sell my Bitcoin before the negative month. Later I can buy back in when the price lowers increasing my overall gain!
By looking at this chart it helps make more informed decisions and also helps me potentially save my ass!
Hopefully, this chart will help everyone else out as well so that you can make better calls.
Thanks so much for stopping by to read and I hope all is well!






