Written by Dimitri Chupryna, Entrepreneur and trader, Dimitri is best known for creating and managing TaaS fund. Publishing this use case with his approval.
Disclaimer: Recently, Dimitri has acquired a meaningful stake of XRT tokens.
In 2015 Sergei Lonshakov assembled a team to create what now is known as Robonomics, an IoT platform for connecting robotics in a blockchain environment. For 5 years they have been writing tons of code, deploying prototypes, engaging with partners — doing everything you would expect an R&D blockchain studio to do, but in a quiet, humble manner.
In the last few months, finally, they have been getting some breakthroughs. Robonomics already developed 13 use cases in collaboration with city administrations, manufacturers, and different tech companies such as Microsoft, MerkleBot and Ocean Protocol.
Recently the team built a bridge from Ethereum and Binance Smart Chain. Since March 16th, you can trade and stake XRT on PancakeSwap, which means 100x cheaper tx fees, and I appreciate that.
A great story full of potential, however, is not uncommon in crypto. So, why Robonomics? Why Robonomics, of all projects, of all coins?
The answer is in the chart. Being a trader, my philosophy is simple: I trade the chart. Chart speaks the truth to me, it tells me everything I need to know. And recently, it has been offering some curious ideas. Let’s take a look.
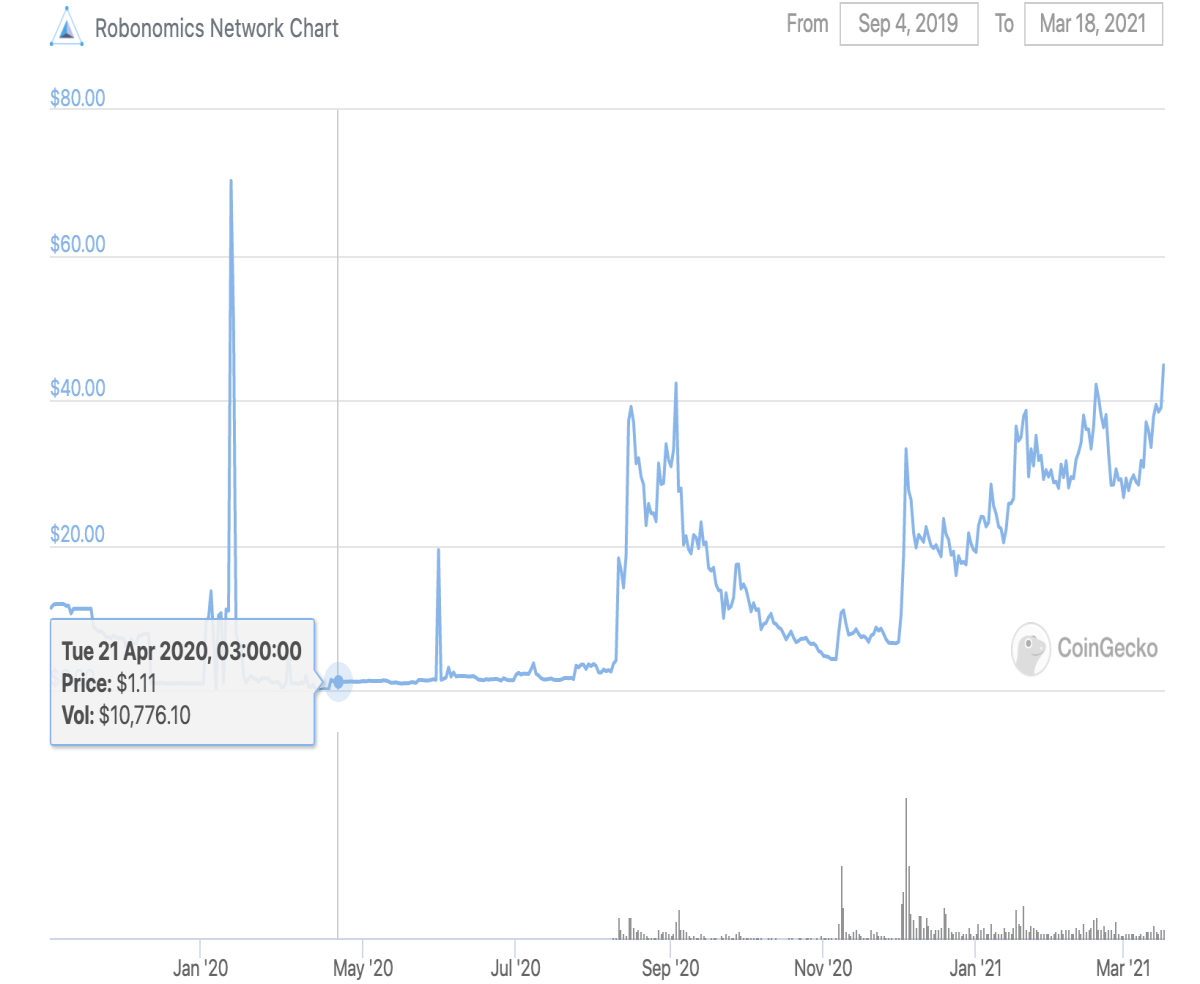
According to Coingecko, history of XRT (Robonomics’ ticker) starts on 21 Apr 2020, with its ticker trading at $1.11, as far as meaningful volume is concerned. It was the very first day it hit more than $10,000 volume. The prior spike occurred on roughly $300 volume, so we will ignore it.
It proceeded to spend a quiet summer ranging around $1-2 and then had its very first true price discovery, with volume entering the illiquid market. XRT shot up to as high as $42 on the 3rd of September, having registered $4.8M tokens worth exchanged that day, roughly 10% of circulating supply. That’s a lot for one day. True price discovery never knows which way to go, so after the $42 peak it unavoidably crashed to as low as $4 and fluctuated wildly. 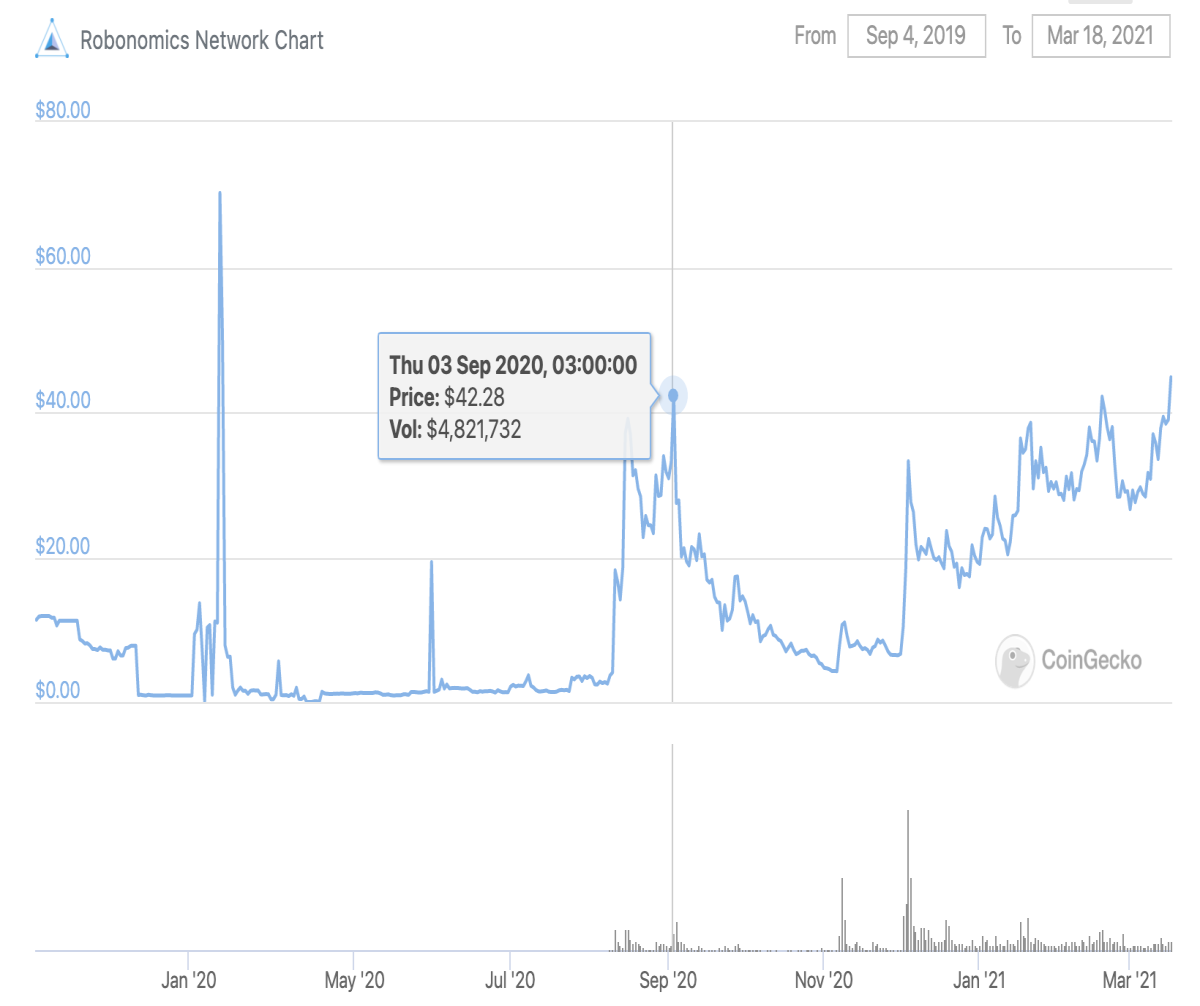
On March 17th 2021, roughly 6 months after the peak, we registered a new all-time high of $45, and there are several reasons to assume the market will go higher.
For a novice trader, looking at a chart that is making new highs is a cruel, psychological torment. Buying a coin that just made a new high seems wrong and repulsive, because they are self-taught to buy “low” and sell “high.” Many experienced traders, on the other side, will tell you this thinking is wrong.
Here is what Mark Minervini, one of the most prolific contemporary US traders, says about the chart making new highs.
“A stock going to a new high is typically a bullish event because the market has eliminated the supply of all previous buyers who had a loss and were waiting to get out at even. That's why stocks often run up very rapidly once they hit new high ground—at that point, there are only happy investors; all the miserable people are out.” (Stock Market Wizards, p.99)
Jesse Livermore, an iconic trader from the early 20th century, would agree with him, for he even wrote a book “How To Trade In Stocks,” outlining in considerable details his “buying a new high” methodology.
Does it work today, in crypto? Oh, yes. Examples may be found in hundreds, but I will present the one you have surely seen unfold live.
Anyone who lived through the mania of 2017 remembers vividly the peak days of December 2017 when Bitcoin approached the $20,000 mark, only to drop in a catastrophic manner weeks after. Truly wild swings, dreamy highs and depressing lows will remain in crypto folklore forever. $20K was the high, the goal to beat for future generations.
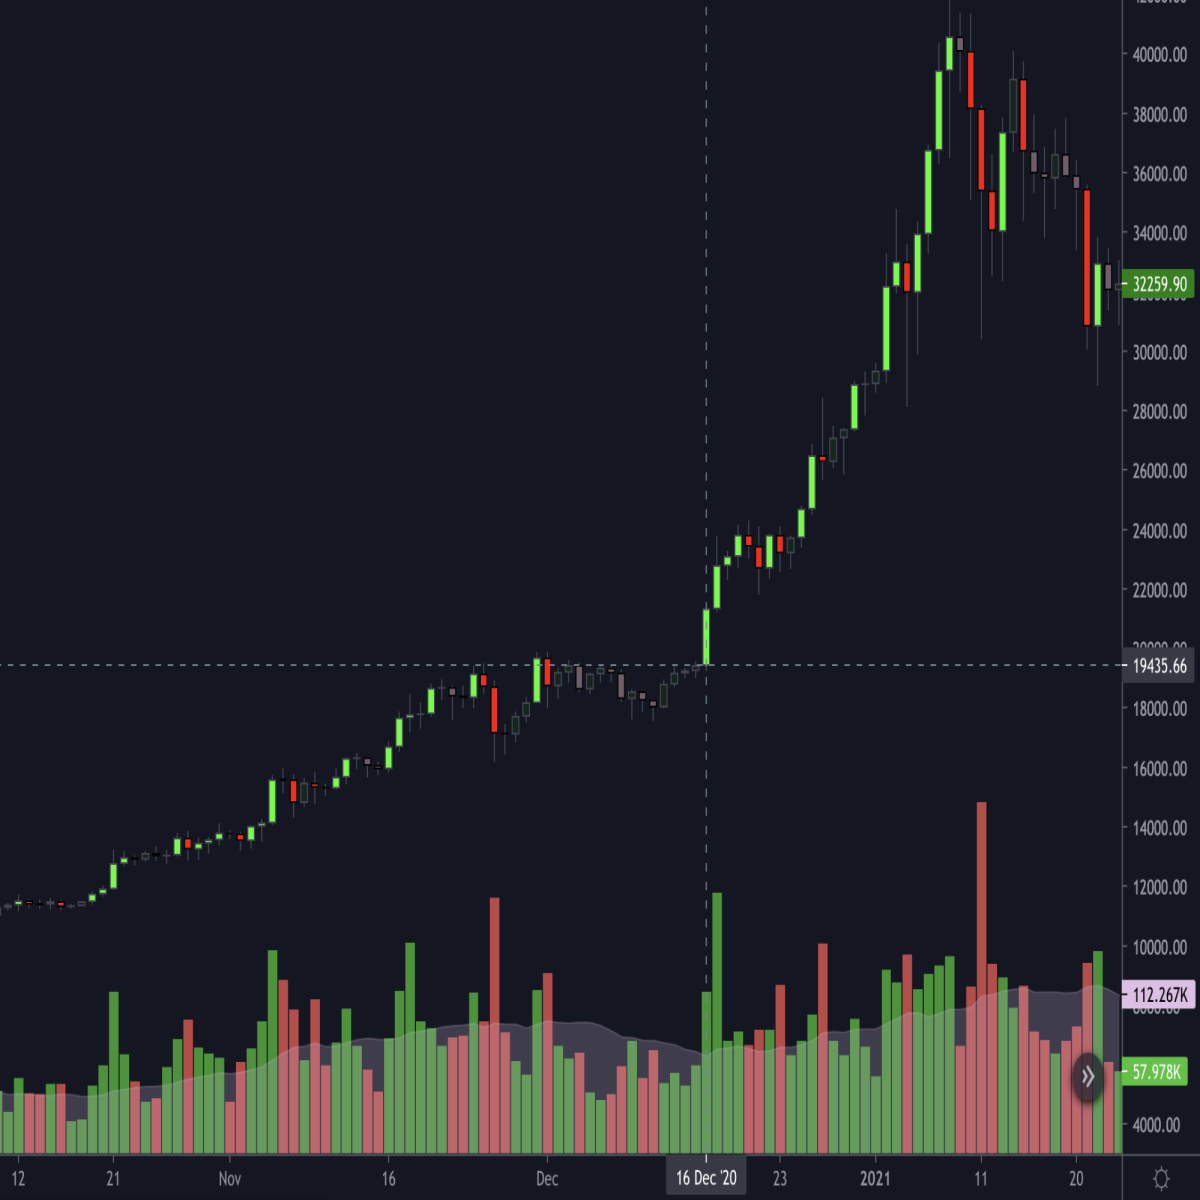
The future arrived quickly. On 16th December 2020 the market broke the target, and in a truly Minervinian fashion the swing that followed doubled the price! Happy chart, running away into the unknown.
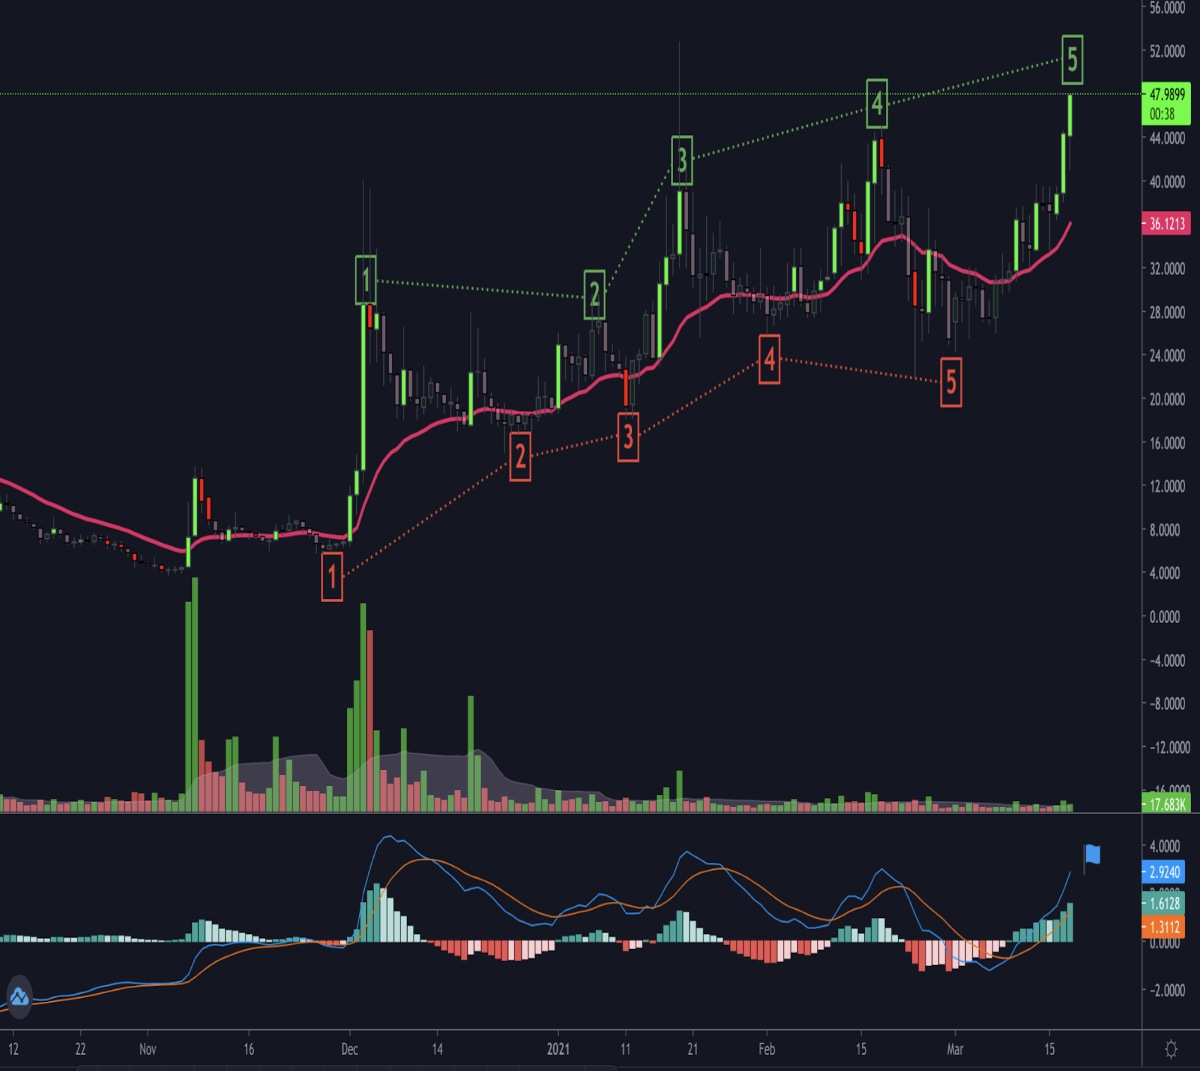
With this information in mind, let’s take a closer look at XRT chart and observe its recent behaviour.
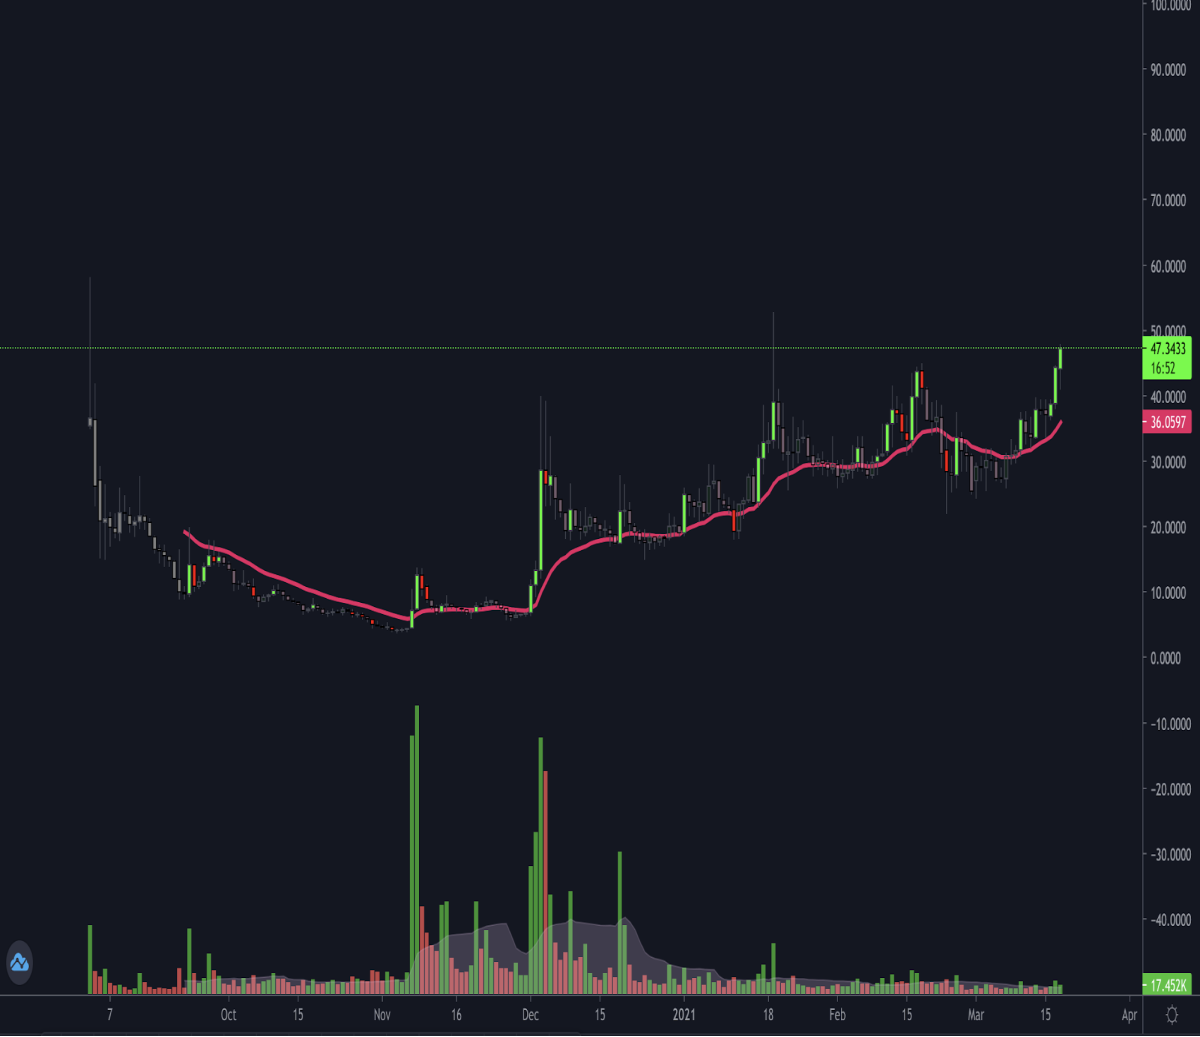
Above is a daily (1D) XRT/USDT chart from Huobi, and we will ignore highs of each day (to avoid slippage discussions) and focus on the close of the day, because data from the close builds supporting indicators. With a naked eye, one can witness recent closes in a completely new, uncharted all-time high territory, above all the previous days. In the words of Minervini, “there are only happy investors.”
Better yet, price flies confidently above a red, thin 20EMA indicator — a basic filter that confirms an uptrend.
How should one trade this chart then? I suggest looking at momentum as a guiding decision-making principle. Momentum is a concept similar to the yin and yang idea, two opposing forces intertwined in a single dance.

The struggle between bulls and bears manifests this concept in the market. Today we have tools to measure the strength of each side’s forces, mapping the territory of the battle accordingly to latest developments, as will be demonstrated by the momentum trendlines idea.
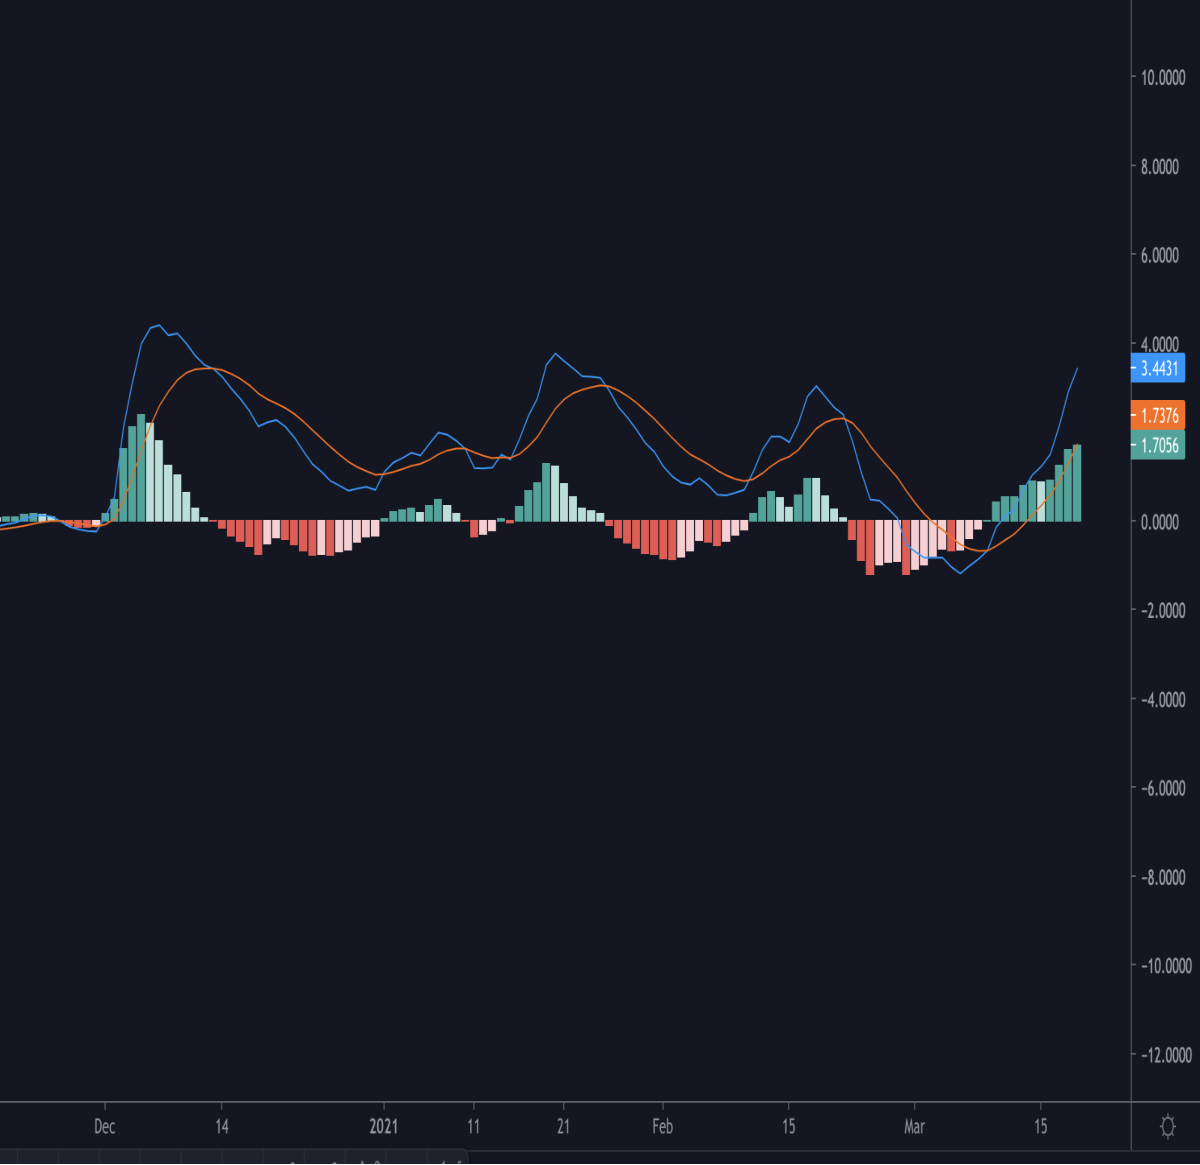
Above is the archipelago-like map of MACD indicator, providing visual representation to the length and the strength of endlessly-changing swings.
Going into more advanced MACD applications, it is feasible to build momentum trendlines, mapping price highs and lows of each consecutive MACD swing.
What is the oldest rule that defines an uptrend? ‘Higher lows and higher highs’ comes to mind.
4 of the previous 5 red MACD swings resulted in moving a ‘swing low’ higher, hinting at weak bears. Bulls seem to be gaining territory. 4/5 green MACD swings achieved a ‘higher high’, with the latest breaching psychological gates of previous $42 peak.
Clear break blessed by an uptrend, a trade Minervini would have surely considered.
From Mark Minervini’s Twitter
As long as the momentum-defined uptrend structure keeps climbing, XRT is a token to be desired. Ending with words from my personal icon Jesse Livermore, “Buy rising stocks and sell falling stocks.” A rule that stands the test of time.


