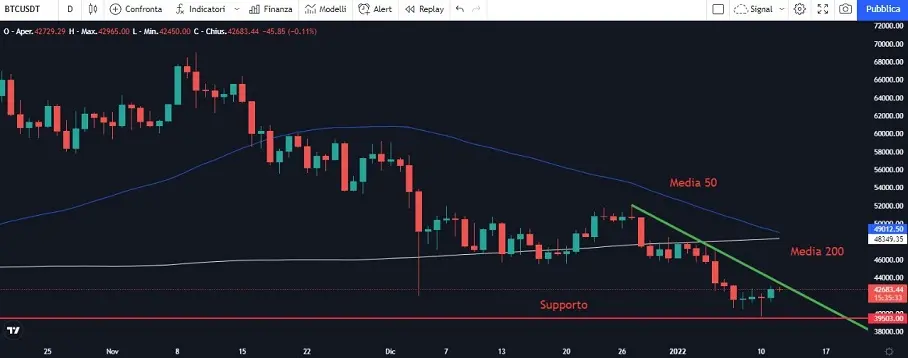
The support at 39500 seems to have held up well more than once. It was touched on January 10, forming a hammer whose high was broken on the upside. We are always below the moving averages at 50 and 200 and it seems that the average at 50 is crossing the average at 200 downwards. Let's see what will happen in the future but we must pay close attention. There would be a need for a break from the green trend line with good volumes.
As usual, I report the levels for intraday trading:
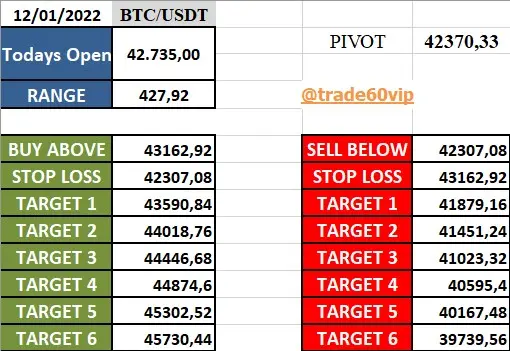
How to interpret the levels?
I use them like this, I use a time frame of 30 minutes and with a close of the candle above the BUY ABOVE price I go long with the relative targets. And the indicated stop loss. I consider the first three targets the most important ones.
A short opening occurs with a price below SELL BELOW with the relative targets and the stop loss.
Log in to Publish0x:
https://www.publish0x.com/?a=oQeZ4DR6bp
Open an account with Kucoin use my code: https://www.kucoin.com/ucenter/signup?rcode=rJEUMUV
Open a Coinbase account to get bonuses 10$
https://www.coinbase.com/join/carote_7
This article does not contain investment advice. Every investment and trading move carries a risk, readers should conduct their own research when making a decision.
THE OPINIONS EXPRESSED BY THE AUTHOR ARE FOR INFORMATION PURPOSES ONLY AND DO NOT CONSTITUTE FINANCIAL, INVESTMENT OR OTHER ADVICE.
Graphic: tradingview.com