Japanese candlesticks are one of the most powerful tools in trading. They condense the psychology of the market into simple, visual patterns that allow traders to understand what’s happening behind price movements. Whether you’re trading stocks, forex, or cryptocurrencies, mastering candlesticks is a foundational step toward becoming a professional trader.
At Olympex, we approach this same principle in decentralized finance, simplifying complex market behavior into transparent, verifiable on-chain signals.
1. What Are Japanese Candlesticks and Why Are They Essential in Trading?
Candlestick charts originated in Japan in the 18th century, introduced by Munehisa Homma, a rice trader who used them to track price movements. Unlike line charts, which only display closing prices, candlesticks capture open, high, low, and close in a single bar, providing far more detail.
Today, they are used across all markets because they give traders a quick visual representation of market sentiment, momentum, and potential reversals.
Press enter or click to view image in full size
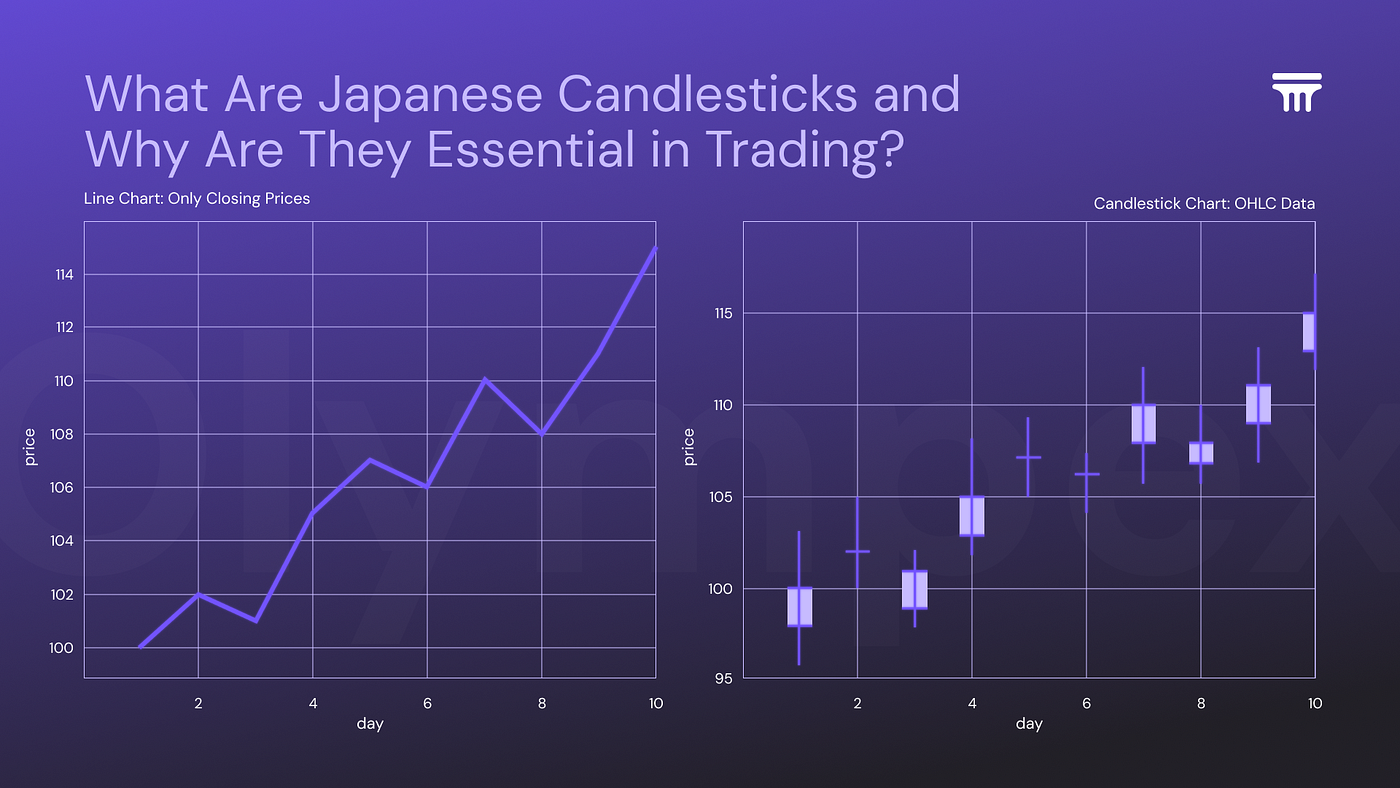
Historical evolution from line chart to candlestick chart, highlighting the additional information provided by candlesticks.
2. The Parts of a Japanese Candlestick: Body, Wicks, and Shadows
Each candlestick has three main components:
- The Body: shows the distance between the opening and closing price.
- The Upper Shadow (Wick): represents the highest price reached.
- The Lower Shadow (Wick): represents the lowest price reached.
If the candle closes higher than it opened, it is typically green (bullish). If it closes lower, it is red (bearish).
This simple structure reveals how buyers and sellers fought during a trading session.
Press enter or click to view image in full size
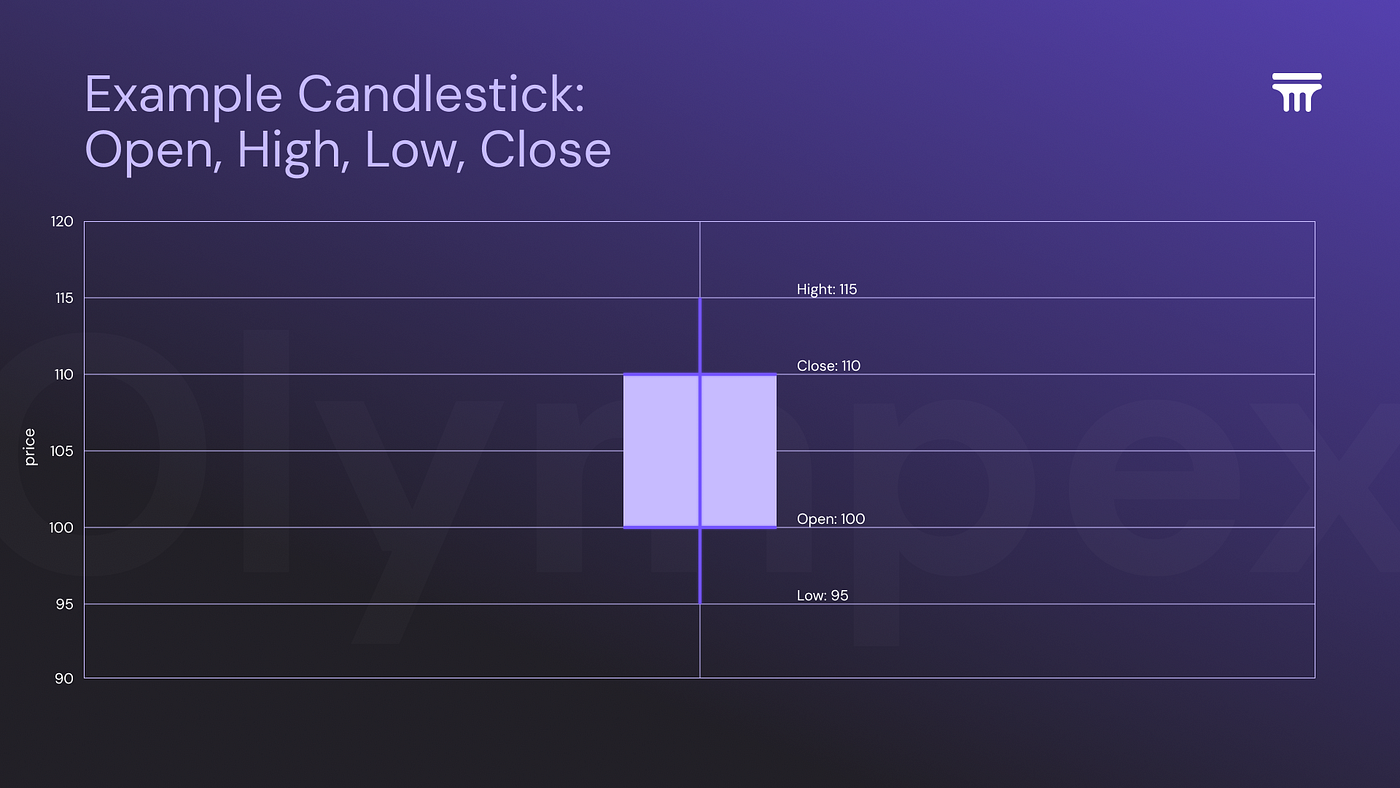
A labeled candlestick showing open, high, low, and close.
3. Bullish vs. Bearish Candles: Understanding Market Psychology
- Bullish Candles (Green/White): Buyers dominated, pushing prices up.
- Bearish Candles (Red/Black): Sellers dominated, pushing prices down.
Reading individual candles allows traders to detect the psychology of the crowd: fear, greed, and hesitation at a glance.
For example:
- A long bullish candle after a downtrend may signal strong buyer interest.
- A long bearish candle after a rally could signal profit-taking or reversal pressure.
Press enter or click to view image in full size
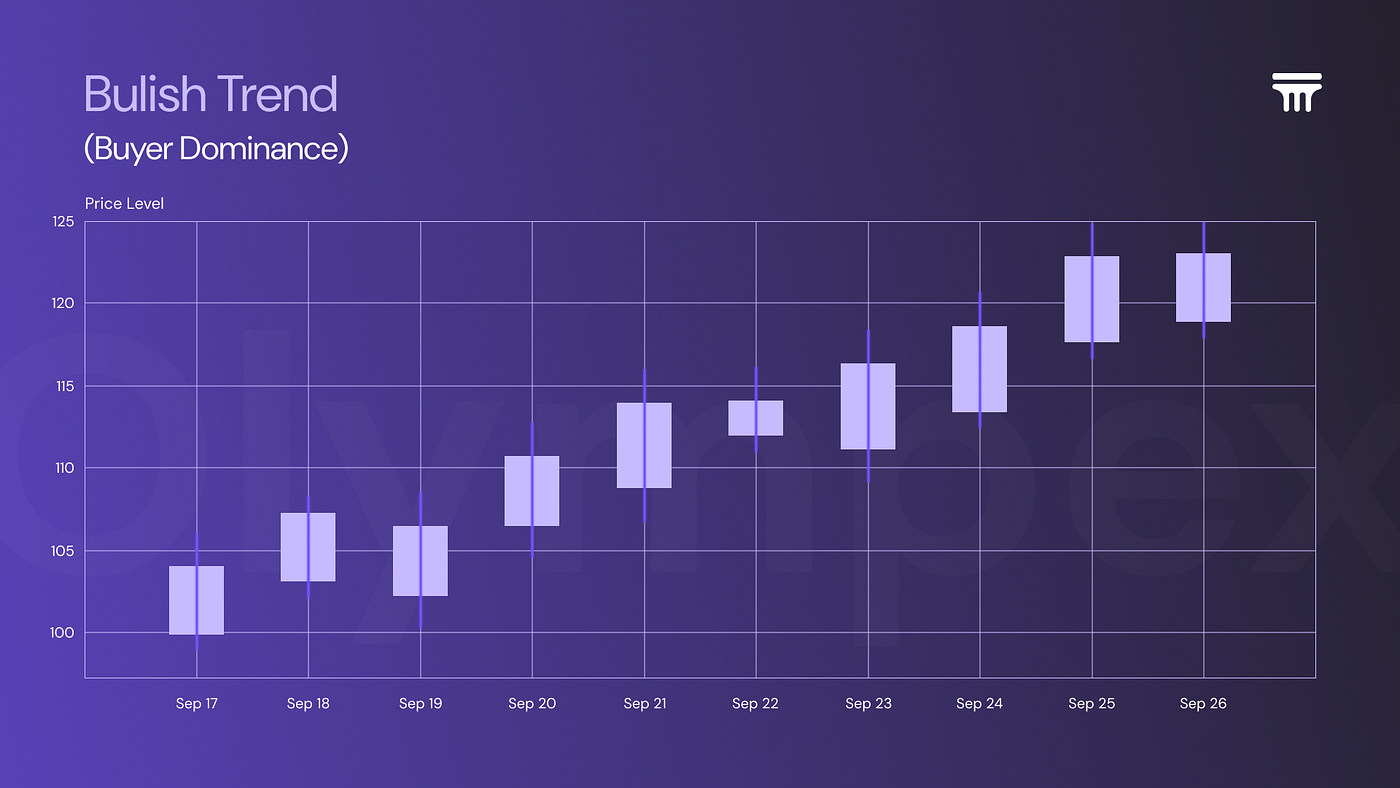
A bullish trend illustrated with multiple green candles, showing buyer dominance
4. Simple Candlestick Patterns Every Trader Must Know
Certain single-candle formations provide early signals of potential trend reversals or continuations.
- Hammer 🛠️: Small body with long lower wick → possible bullish reversal.
- Shooting Star 🌠: Small body with long upper wick → possible bearish reversal.
- Doji ✝️: Open ≈ Close → indecision in the market.
- Engulfing Pattern: A candle fully covers the previous one → strong reversal signal.
These patterns are most reliable when confirmed by other technical tools (support/resistance, trendlines, or volume).
Press enter or click to view image in full size
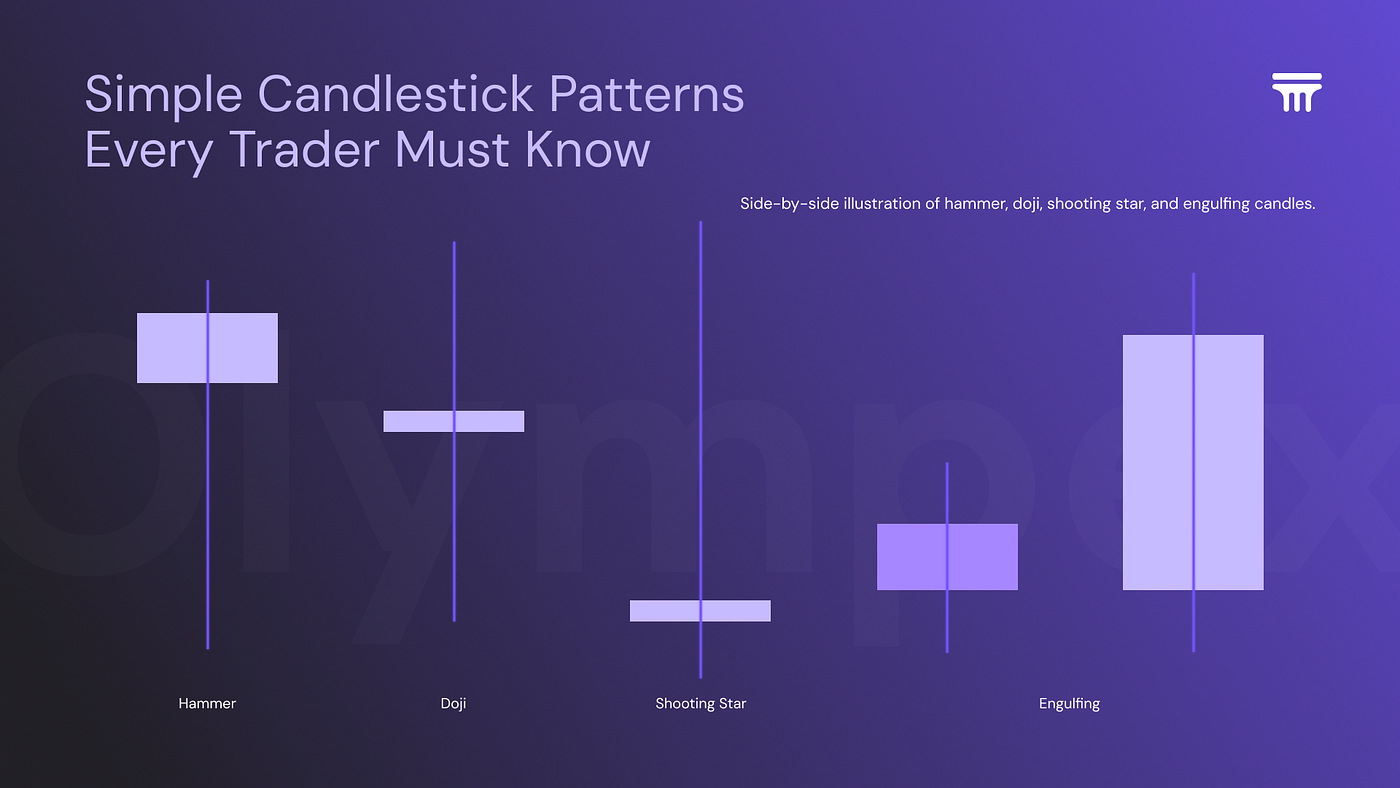
Side-by-side illustration of hammer, doji, shooting star, and engulfing candles.
5. Common Mistakes When Reading Japanese Candlesticks
Many beginners fall into traps when interpreting candles. Avoid these mistakes:
- Overinterpreting a single candle without considering the broader context.
- Ignoring volume, a candle pattern with low volume is less significant.
- Forgetting market conditions, patterns are weaker in choppy, sideways markets.
- Confirmation bias, seeing what you want to see instead of what the chart is showing.
The key is always to combine candlesticks with market structure and context.
Press enter or click to view image in full size
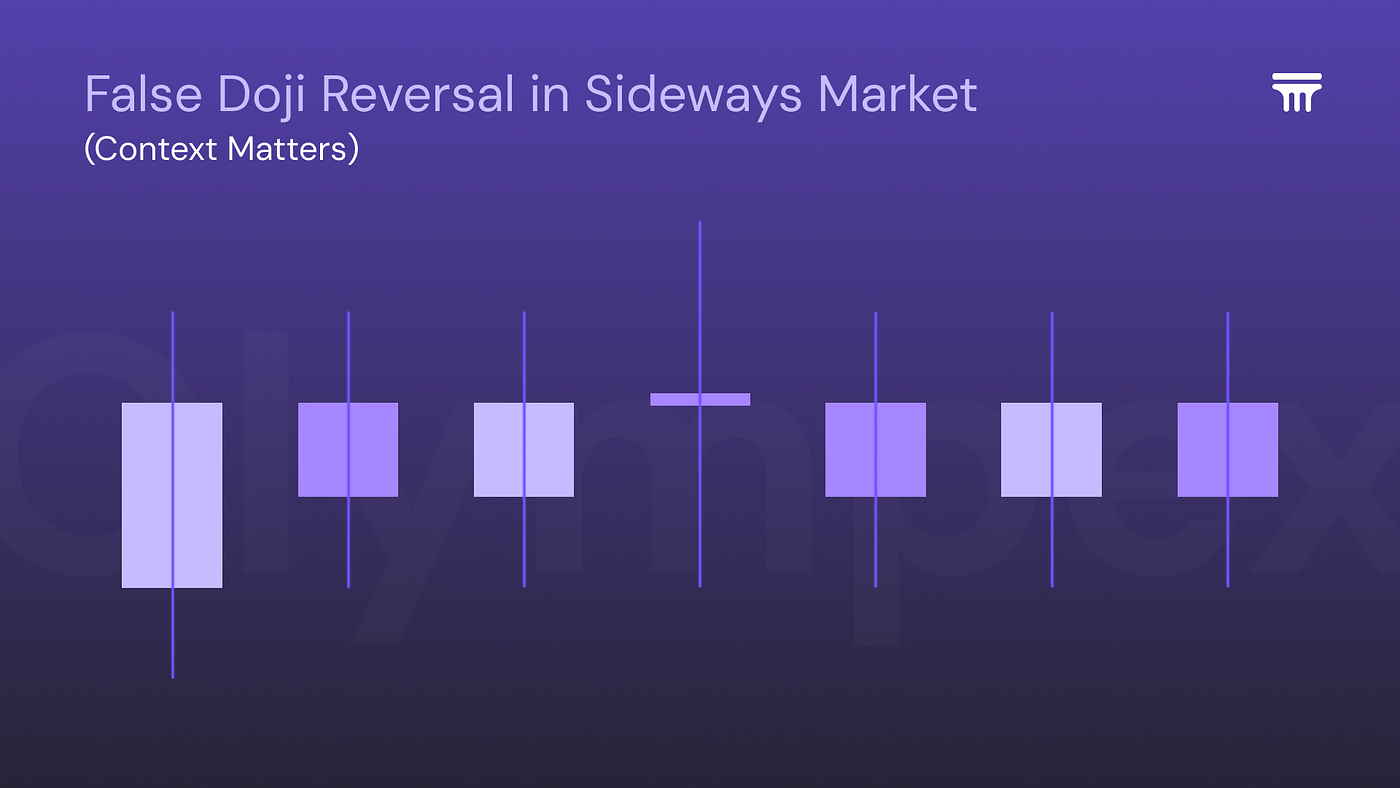
A false doji reversal in a sideways market, highlighting why context matters.
6. Exercise: Apply Your Knowledge
Look at a candlestick chart of BTC/USDT (daily timeframe).
- Identify one bullish candle and one bearish candle.
- Find an example of a hammer or shooting star.
- Check if the pattern was confirmed by trend continuation or reversal in the following candles.
Write down your interpretation: Did the candlestick signal correctly predict market behavior, or was it a false signal?
This practice will help you build the discipline to read markets objectively.
Conclusion: Mastering Candlesticks Is the First Step, Not the Last
Japanese candlesticks are more than just charting tools; they are a window into market psychology. By mastering them, traders gain the ability to interpret the battle between buyers and sellers, anticipate reversals, and recognize continuation patterns.
However, candlesticks alone don’t guarantee success. They must be integrated with support and resistance, trendlines, moving averages, and market sentiment indicators to build a robust strategy.
Think of candlesticks as learning the alphabet of trading. Once you understand it, you can form words, sentences, and eventually tell the entire story of the market. And just like learning a language, mastery comes with repetition, practice, and reflection.
In the long run, the traders who succeed are those who combine knowledge of candlesticks with patience, discipline, and a clear strategy.