Daily chart https://www.tradingview.com/x/v7PnF5vf/
DON'T FORGET TO JOIN OUD DISCORD SERVER!!!
Last week we had a small increase from the failling wedge on the lower timeframe but as expected we were pushed back to the blue support zone. Here we have been able to print a higher high and there has been a strong bounce towards the red resistance zone. As it looks now a higer high will be confirmed tomorrow and could be the first signs of an outbreak from the fallingwedge. Looking at the ema's then they are beautiful for it. The ema100 is above ema200 (short above long is bullish signal) and both offer support. The sma200 also has confluence with the blue support zone that is drawn in. Looking at the other indicator we see that the rsi is just above the center line and above the ema. These are also positive signals for the Ripple bulls below us.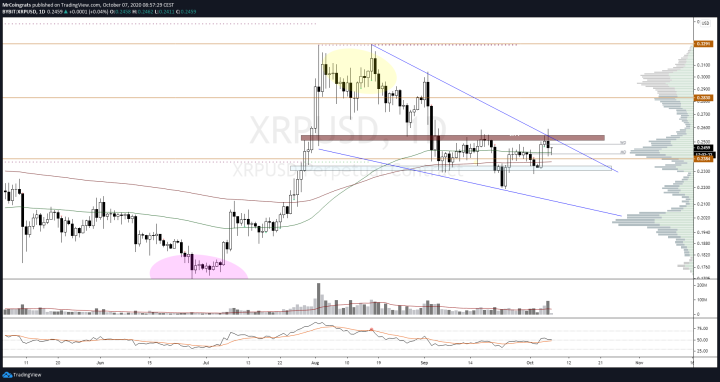
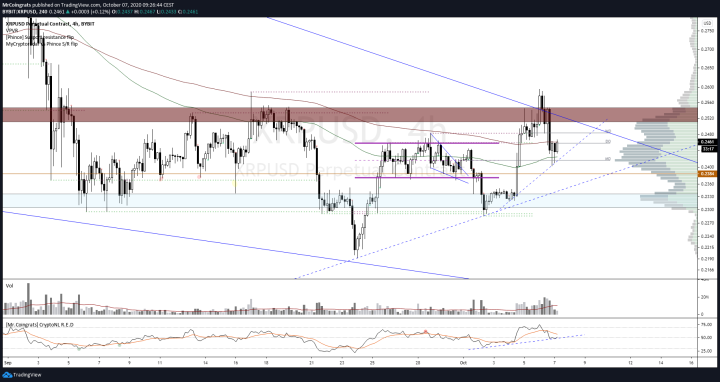
4h chart https://www.tradingview.com/x/DkPg3nlf/
Here we can clearly see the slight rise from the falling wedge and we can see it being pushed back before the top of the range. We can also see the higer low here and we are currently working on a slight higer low after a higer high has been printed. The upward trend line can also be seen rising faster than before when setting a new HL. These are good bullish signals. However, the ema's are still bearishly crossed here and the ema200 is currently functioning as resistance and the ema100 as support.
The rsi also manages to print a higer low and currently respects the upward trend line. The rsi is below the ema which is falling. The added ema can be used as a resistor and support on the rsi.
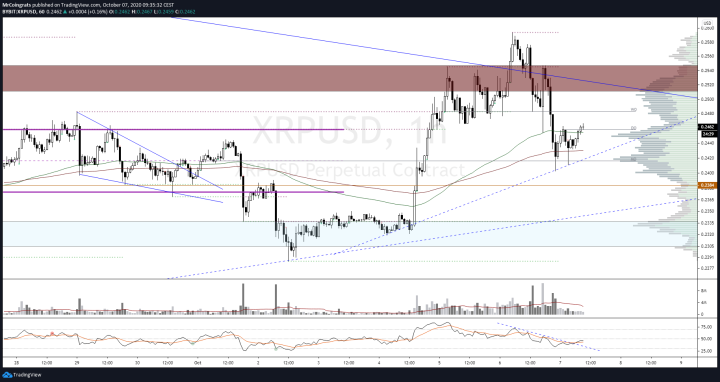
1h chart https://www.tradingview.com/x/ewtYyhgq/
Here we can already see the first signs of an upward move. Here is clearly a higer low printed and the ema's are crossed bullishly. Last 2 candle closes have been above the ema100, let's see if we can keep the price above it. The volume is decreasing but that is quite normal at the end of a pennant or triangle (blue line with blue - - line). The rsi has crossed the downtrend line and also the ema. At the moment the rsi still has trouble crossing the middle line. Overall I am quite positive for the XRP course but to get really bullish the red bear block should be flipped to support. The price here is around $0.25.
DON'T FORGET TO JOIN OUD DISCORD SERVER!!!