
Ripple has been trading between the blue and red zone for another week. Will this finally be the week that we can close up above? The indicators on the week graph at least show upside potential. The ema55 offers support and has confluence with the red bear block. The rsi has been above the midline for weeks with a very slightly falling ema. The lbr has risen above the middle line and is about to cross the signalline bullish.
➡️ Join our free crypto Discord server and come talk about crypto charts
Weekly chart: 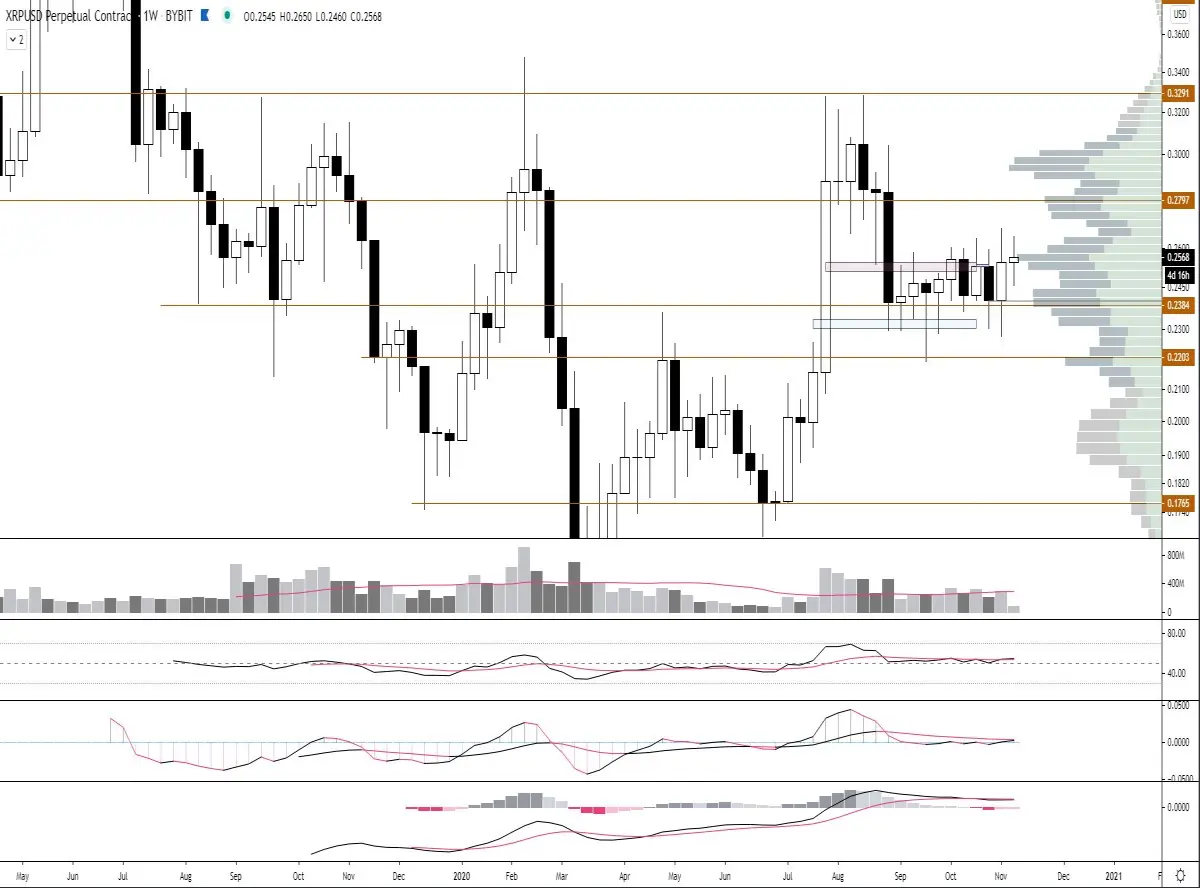
When we pull through the red zone we don't see a clear flip on the daily chart. This is something you would like to see but as indicated last week it is a tough zone. The uptrend line hasn't been able to hold its own and at the moment XRP has been trading against the same trend line for days and is experiencing quite some resistance. The indicators are still in good shape for an eventual rise. The ema55, 100 and 200 all offer support and are more or less in line with each other. The rsi moves neatly above the center line and the ema, both running parallel to each other. Hetzelfe applies to the lbr. In theory a higer low has been set and it is now waiting for the confirmation of a higer high. The red zone and the blue - - trend line will be broken immediately.
Daily chart: 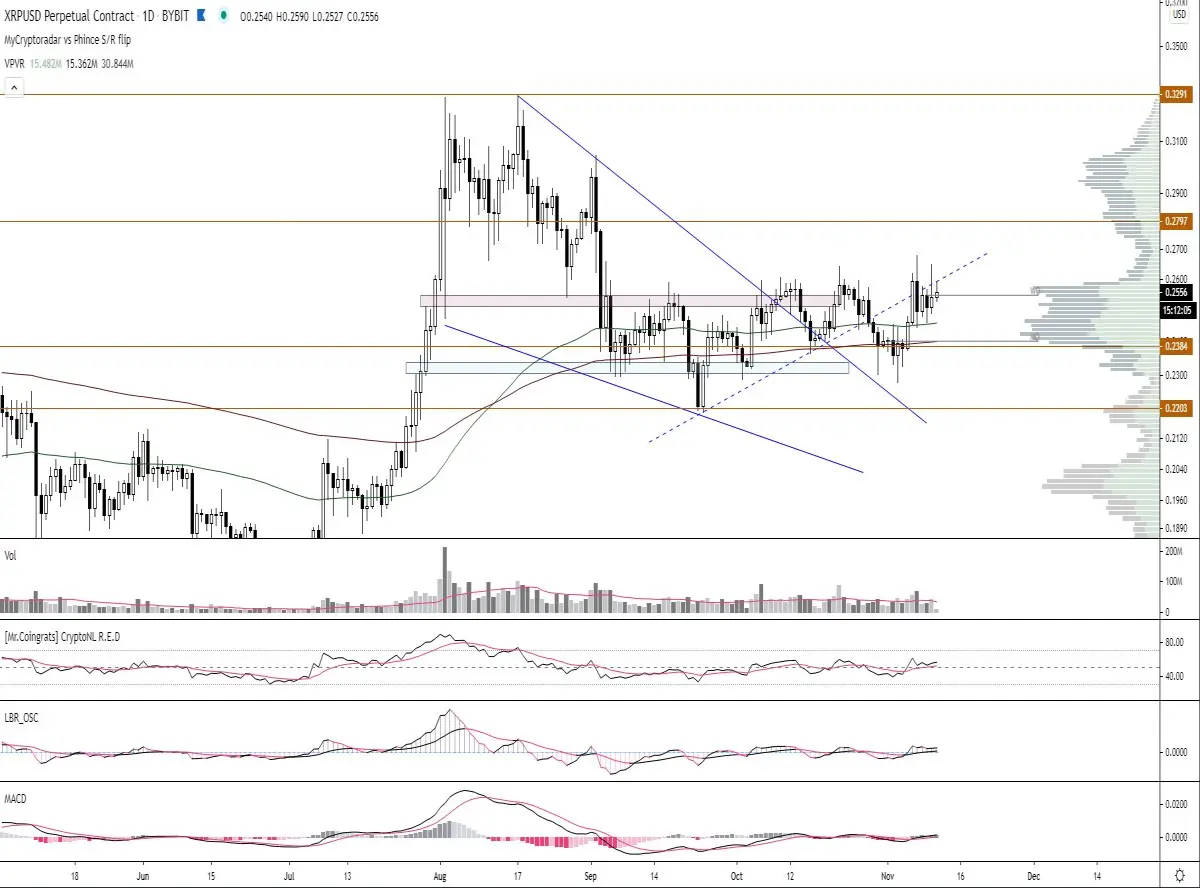
The turtle soup pattern has indeed played. With this pattern the stops are hounted, as it were, (retail) traders will make their stop at the first red bow. At the next red arc you'll see that the stops have been taken, after which the price has risen by a maximum of 17%. At the moment higer lows are being set, but even here a higer high will be postponed for the time being. The red uptrend line together with the grey resistance block forms an ascending triangle which has the best chance of breaking out upwards. But as you have been able to see last week, that of last week hasn't broken out upwards either. Personally I do look at patterns but hardly trade on them. Horizontal support and resistance levels are many times stronger and easier to trade.
The ema's do look bullish but are also quite similar. This means that there is still little bullish momentum. The rsi and lbr both confirm this. Both know how to stay above the middle line and above the ema and signal line.
4h chart: 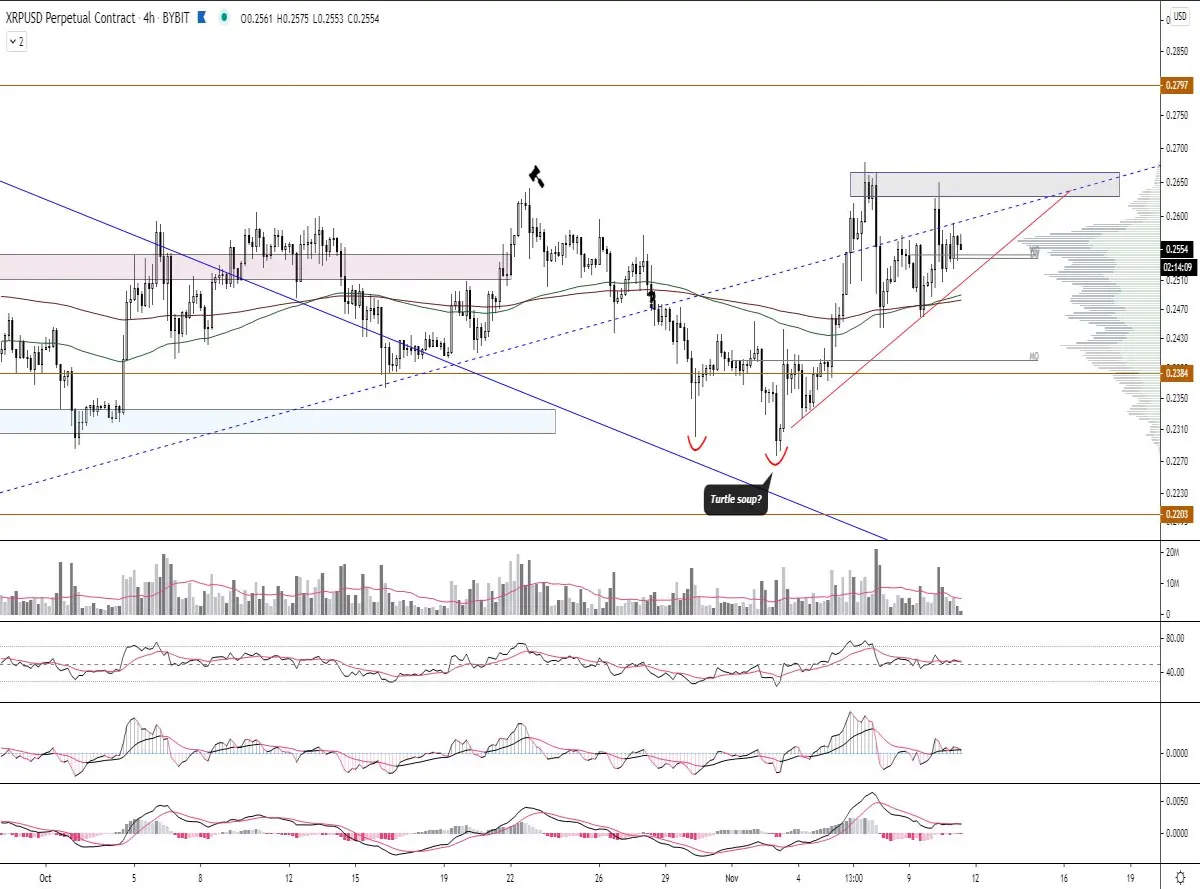
Conclusion:
For the coming time I will keep an eye on the trend lines of the ascending triangle. A 4h candle close below the red trend line would mean that there is a big chance that the monthly will be tested open. This is just above the orange horizontal support line at 0.2384 We can be really bullish after the grey zone has flipped from resistance to support. Here you will also find confluence with the aforementioned blue - - trend line which will also flip. The price to flip is around 0.2643 with the next resistance at 0.2797.
➡️ Join our free crypto Discord server and come talk about crypto charts






