Bitcoin doesn't seem to stop yet. With the exception of some small pullbacks that are neatly absorbed by the horizontal support zones, the course is already rising steadily from September / October.
We will therefore also take you through the lower timeframes this week because, as you can see on the daily, there is little info except for the Fibonacci levels that we also mentioned the last two weeks. Furthermore we see a parabolic increase for BTC.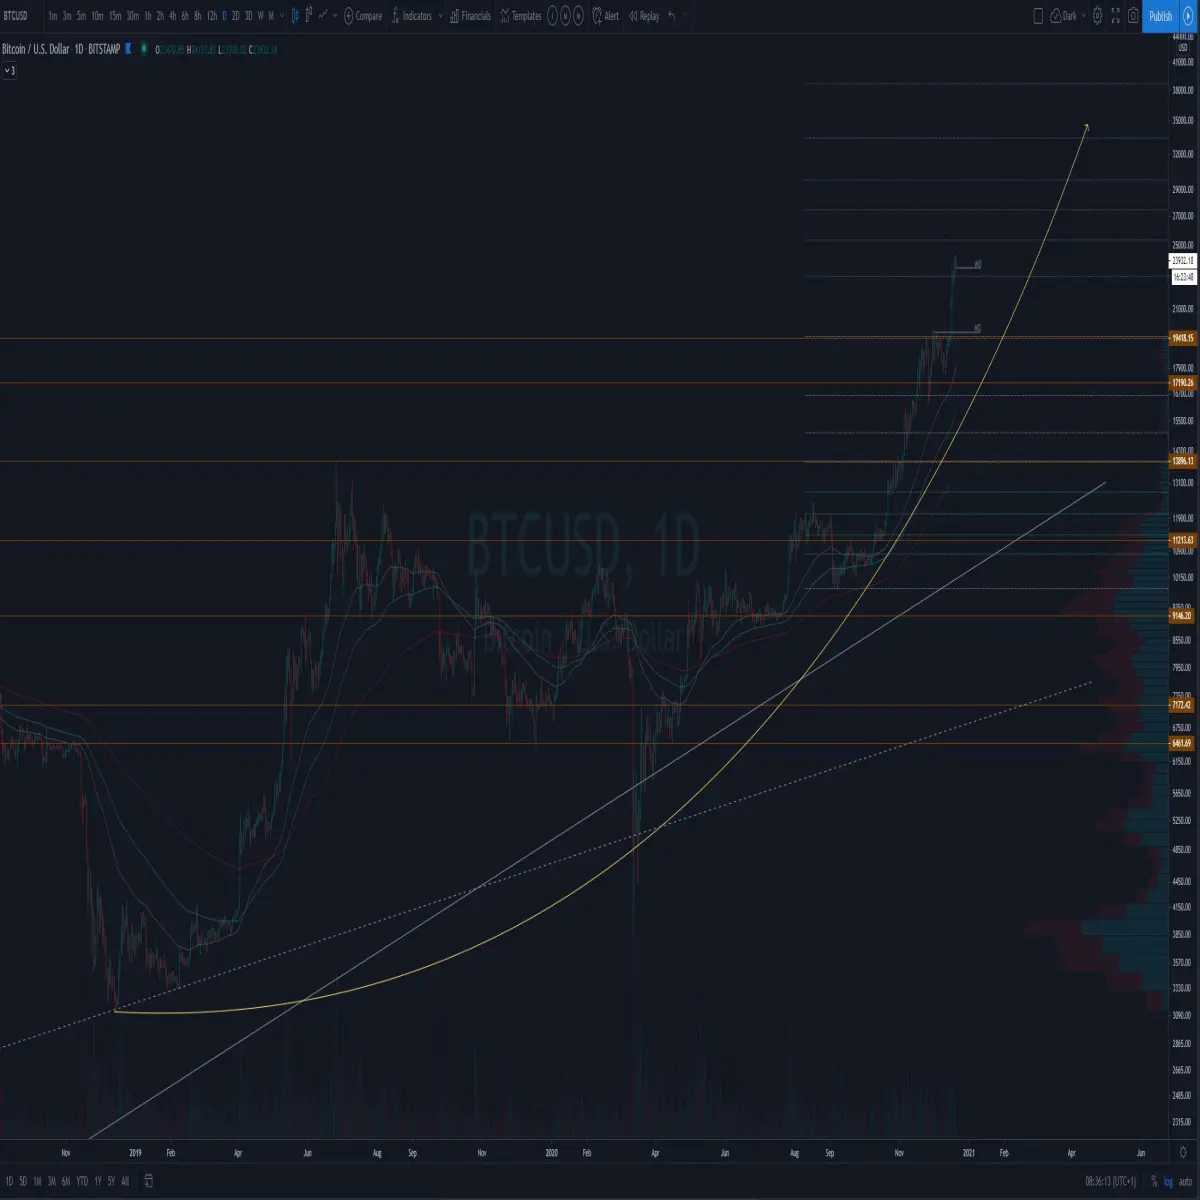
On the 4 hour chart BTC is currently experiencing resistance and we could turn it into a rising wedge. The upper trend line also shows us a bear divergence where the rsi has already tapped the trend line three times. This often indicates a good confirmation. If it is going to play and how far we can go down we will take a look at the 1 hour chart.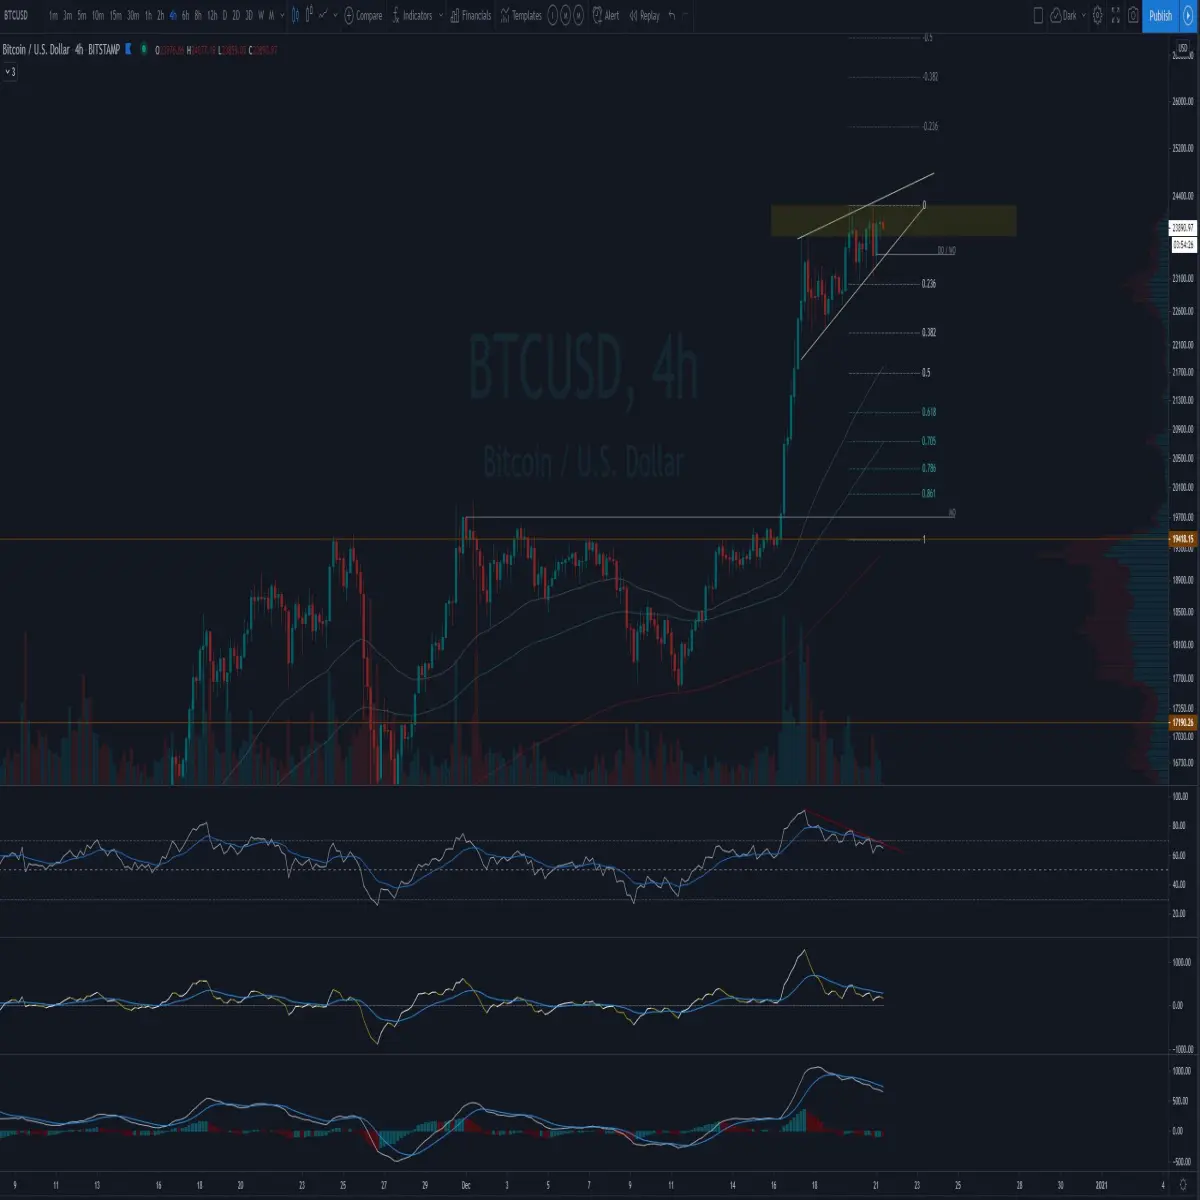
On the 1 hour chart we also saw a bear divergence where the price dropped over 4% to the bottom of the sideways range where BTC is in on the LTF. Also confluence with the bottom trend line of the rising wedge. To have some chance of an outbreak at the top of the rising wedge, the EQ of the sideways range should serve as support.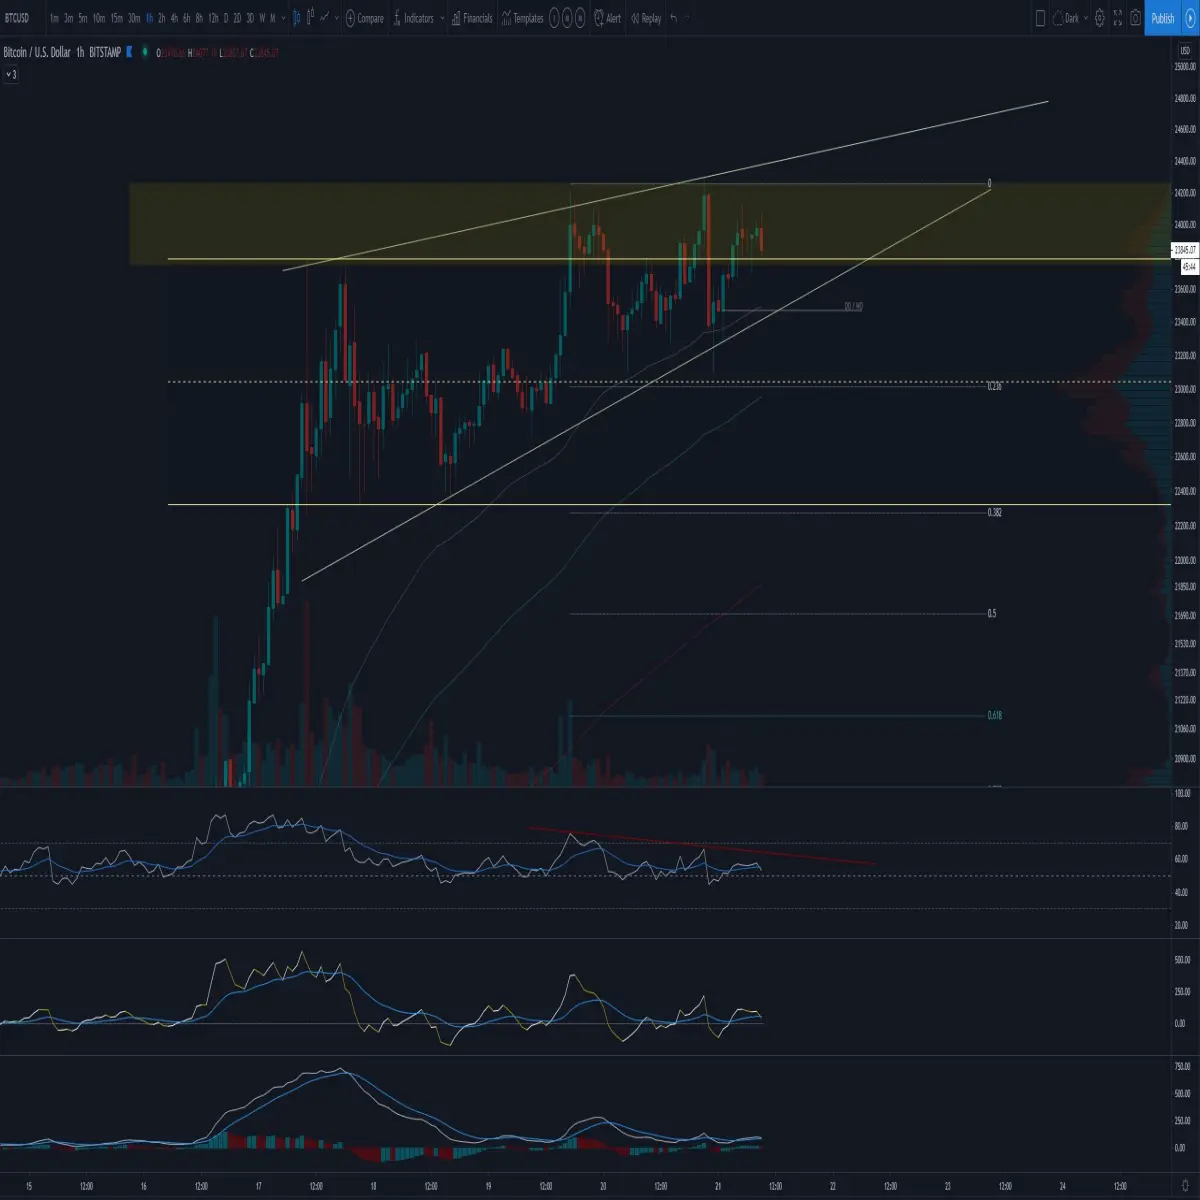
Conclusion:
As long as we can close the HTF above $19984 I am bullish on BTC for the lung term. However, on the lower timeframes I do expect a pullback one of these days unless, as mentioned before, the rising wedge on the top is broken. When the bear divergence starts to play out I expect a retrace to 20.5K - 21K. The next support below that will be $19984.
Also, If you are interested in trading, I would suggest you try out Coingrats free Discord server where we discuss the market and share interesting content. We have also have a free premium section where we share trading signals for Bybit. More info in our Discord server






