
Daily chart
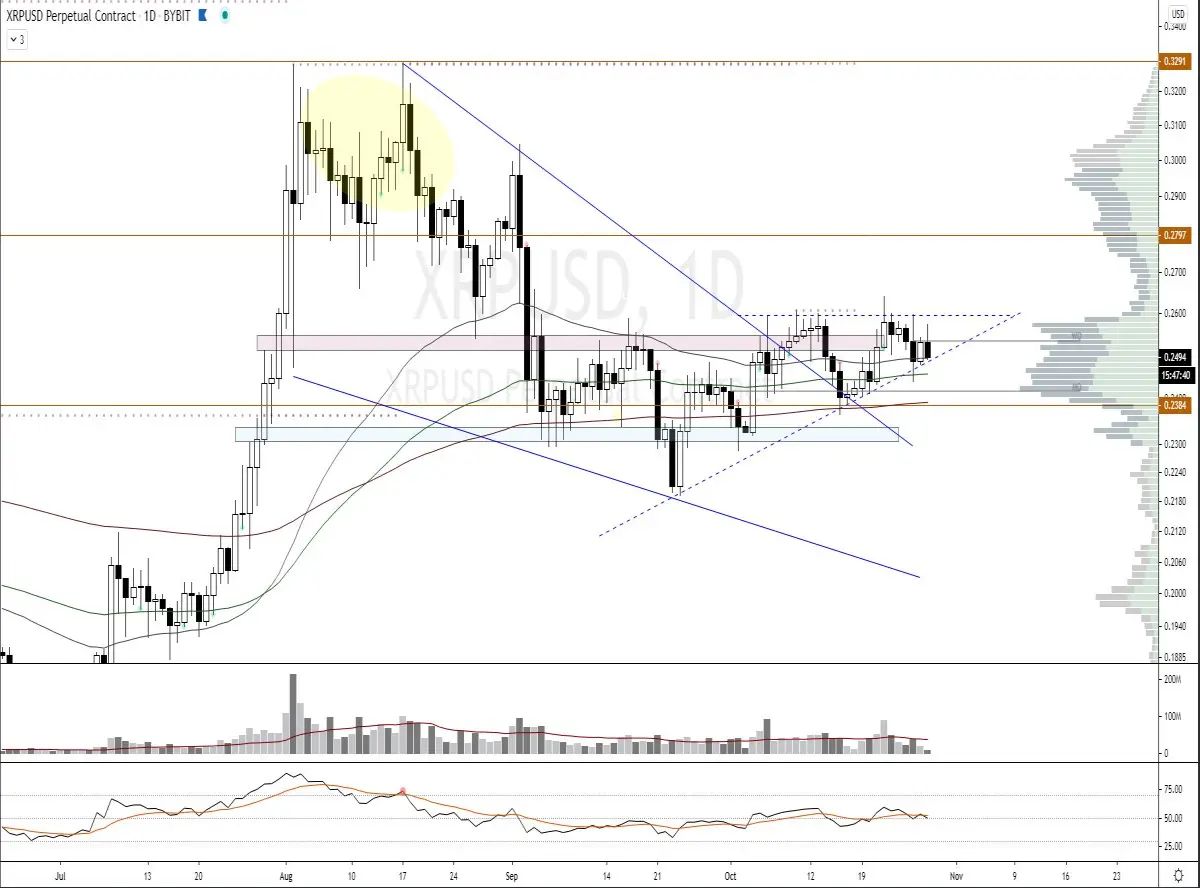
Last week the red zone has not really flipped as we would like to see it. The uptrend line ( - - blue) is holding up quite well and is forming an ascending triangle. An outbreak upwards has just a little more chance than an outbreak downwards of a scending triangle. We now also see the volume decrease as we get closer to the apex of the triangle. This is often a good sign because an outbreak requires volume that is most likely being built up now. Although the rsi has dived below the ema and may also go below the center line today, the rest of the indicators look nice. The ema's offer constant support and also on the volume profile (right) we see a strong resistance / support zone where we are currently trading for almost 3 weeks.
4h chart
For a moment it looked like XRP was going to flip the resistance block but after setting a higer high the bulls couldn't keep up and it was nothing more or less than a fake out of the triangle. The drop that followed has created a channel that is currently trading below the median line. The ema's are still in bull mode however we should be a reversal in the next few hours as we are trading on the lower trend line of the triangle. The volume is slowly increasing and also the rsi seems to want to go up again but will first encounter resistance from the median line and ema.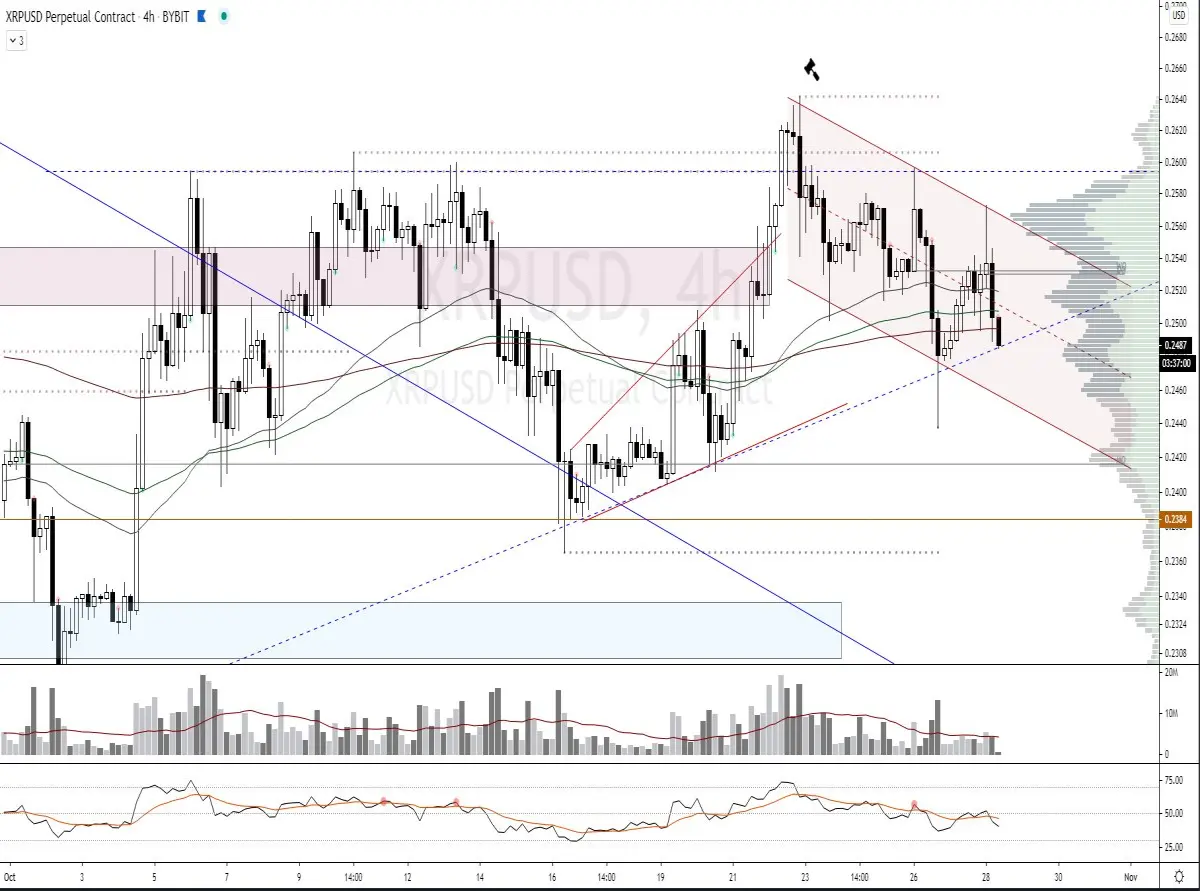
1h chart
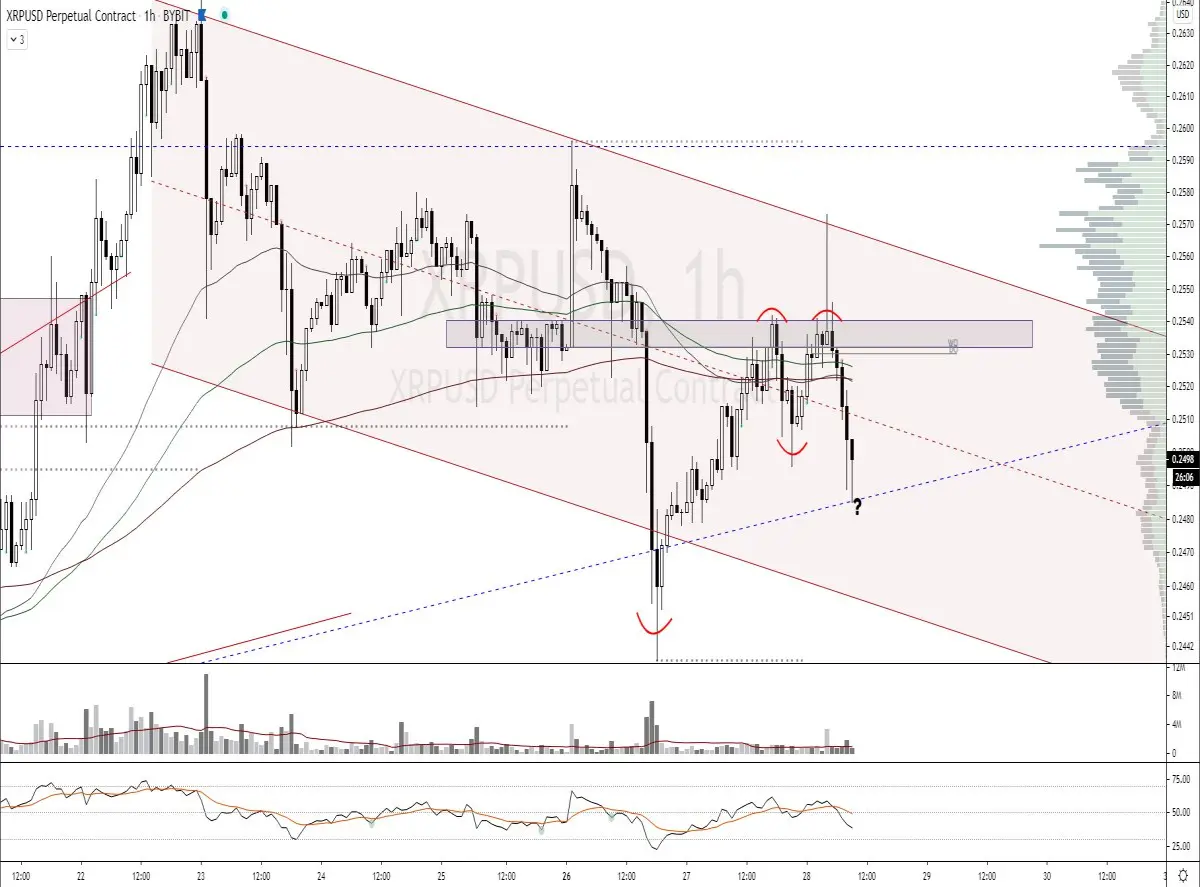
Assuming that everyone wants to see the price rise, this is not a very strong chart. After the first test on the resistance zone, a higer is set low and then tested again. Here a very ugly candle is formed with a decent wick at the top which confirms that the bears are pushing the price significantly. A dubble top was formed and the price dropped back to the lower trend line of the triangle in no time. Now it remains to be seen what kind of candle pattern will form here.
Conclusion:
At the moment we are at a point of do or die. If the price is falling through the trend line of the triangle it would not be very strange to visit the monthly open (0.2416). But as long as the trend line holds, we can look carefully up at the grey block. This zone (0.2540) we have to flip on the lower timeframe to get really bullish on the higher timeframe. Only then we can start to see if the ascending triangle can be flipped (0.2596) only then we can look further.
➡️ Join our free crypto Discord server and come talk about crypto charts
➡️ Get free lifetime access to our margin VIP room by making account on Bybit using this link and deposit 0.05BTC or more. Sent me your UID in our Discord channel or by a DM
➡️ Get $50 free when you ordered a crypto visa card from crypto.com using this link. (reff code: mk9r332rp2)






