
Ultimate Oscillator is a kind of momentum oscillator indicator.
Being an oscillator indicator, Ultimate oscillator indicator was created by Larry Williams with the main objective of helping traders to know whether the market is trending upward or in a downward direction using the 7,14 and 28 period.
Just like in other oscillator indicators ultimate oscillator is also based on divergence as well as oversold and overbought in the market.This will allow the trader to know when to enter or exit the market.
Therefore, Ultimate oscillator concept of overbought and oversold as well as divergence is further being explained as follows;
Concept of overbought and oversold
Mostly similar to RSI, Ultimate oscillator indicator oscillates from 20 to 80 with overbought market at above 70 and oversold at below 30. Therefore, we can say that when the ultimate oscillator indicator falls below 30 that will be an indicator of an oversold market condition thus signaling the trader to close any sell position and open a buy position while when the ultimate oscillator indicator rises above 70 that will be an indication of an overbought market condition thus signaling the trader to close any buy position and open a sell position. This is indicated from the candlesticks chart below;
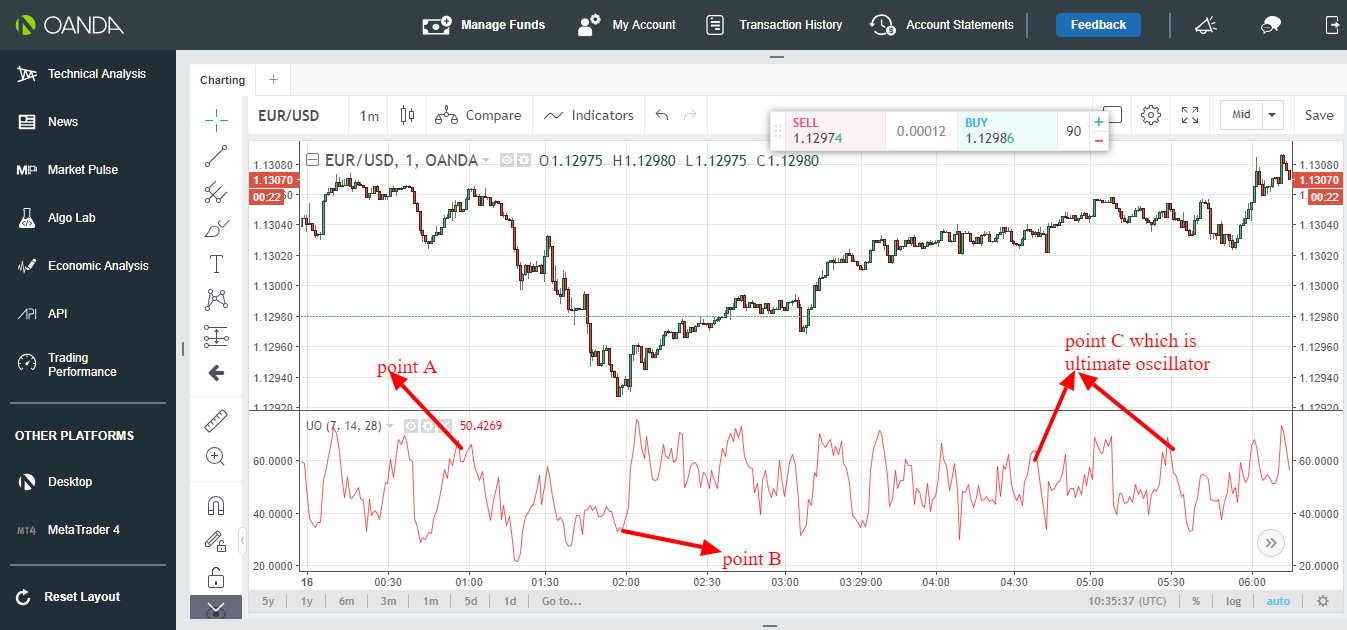
From the candle sticks chart above,there are 3 points,point A,B and C . Point C represents the ultimate oscillator curve while point A and B represents overbought and oversold market condition. At point A, the ultimate oscillator has risen above 70 thus an indication of an overbought market condition at that point.This will signal the trader to close any buy position at that point and open a sell position since the market is starting to move downwards. On the other hand, at point B, the ultimate oscillator has fallen below 30 thus an indication of an oversold market condition at that point. This will signal the trader to close any sell position and open a buy position since the market is starting to move upwards.
Concept of divergence
Using the concept of divergence, when the market is in an upwards direction while the ultimate oscillator is moving downwards, the market will reverse and start moving downwards in the same direction as the ultimate oscillator while when the market is in a downward direction while the ultimate oscillator is moving upwards, the market will reverse and start moving in the same direction upwards as the ultimate oscillator indicator. This is indicated as from the candlesticks chart below;

From the candlesticks chart above, the two joining arrows indicate the ultimate oscillator while point A represent a downwards ultimate oscillator movement. On the other hand, point B represents an upward ultimate oscillator movement. At point A, the market was moving upwards while the ultimate oscillator was moving downwards. The market then reverse and start moving downwards as the ultimate oscillator indicator thus signaling the trader to be trading in a downward market direction at that point.On the other hand, at point B, the market was moving downwards while the ultimate oscillator was moving upwards. The market then reverse and start moving upwards in the same direction as the ultimate oscillator.
Recommendation: If you are a day trader, use 1 min,5 min,15 min, and 30 min timeframe while if you are a swing trader just use 1 hour and above timeframe if you want Ultimate oscillator indicator to work well for you.
If you would like to support our work, here is our tipping details;
skrill donation:[email protected]
Neteller donation:[email protected]
Bitcoin:1Fp5aLgRB6WJnC7nxGw57M3JbbexaAWHG2
Ethereum; 0x346570c491b76c7cd51699bdd272762111b743a9
Litecoin: LeEH7B82ccXJ6QoibCryGJNpDGNx2x77fL
Dogecoin: DLShs2vqhMc1ggqo8MPPMBTcPAZdqCZoWd






