![Update [CND/BTC - BAT/BTC - new pair added ENJ/BTC]](https://www.publish0x.com/img/90165.webp?action=resize&ar=1&enc=webp&inv=0&ori=1&st=1&up=1&w=1140&signature=e23ec0e43b95687cd17960acd1449f4fca48d1a5c3f5c6ece11466935027859a)
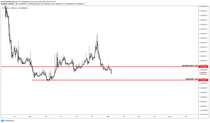
CND seen from the 1D timing we can see how the previous candlestick closure has broken the pattern and has fallen below the support diagonally, the price has touched our stop loss calculated in 16% of loss, currently the price should continue to fall, therefore we should expect a new entry signal below the weekly demand located at 0.00000057 indicated within the chart by the red horizontal.
In conclusion, CND has not managed to flip the resistance at 0.00000087, the upward movement of BTC has hurt the overall performance of altcoins, this currency is withdrawn from the weekly monitoring (closed by stop loss).
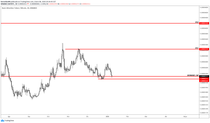
BAT seen from the 1D timing we can see how the price has tested the weekly support located at 0.00002311 indicated inside the chart by the red horizontal, we have lost the key zone in 1D located at 0.00002412, so we must be very attentive to the closing of the candle today and tomorrow's confirmation, if we lose the weekly support, the price could fall below 0.00002223 and we would have to wait for a new signal to enter long.
In conclusion, BAT is still in the buy zone, today's candlestick close will be important to determine the next move, we need a bullish candlestick close today or in tomorrow's confirmation to be able to see a rally and look for the recovery of the support located at 0.00002412, therefore I recommend to be very attentive to the 1D price action and always remember to place your stop losses to avoid possible invalidations during the move.
New pair added to the tracker (ENJ / BTC):
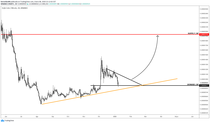
ENJ seen from the 1D timing we can see how the price has reached an important zone of demand located at 0.00000873 indicated inside the chart by the black horizontal, the current candlestick is testing that level, however we still need to wait for the candlestick to close, to have a bullish continuation we need the candlestick structure to form a double floor over the same level or with an upward slope that increases the probabilities, inside the chart I have also drawn the diagonal resistance that we need to break to continue with a new bullish upward movement in 1D.
The strategy to follow:
Wait for the price to draw a reversal pattern by closing candles horizontally to the first LL that forms the price or with an upward slope forming an HL that increases the probability of a resistance breakout, once we have this pattern we must wait for a powerful candlestick closure on the diagonal drop, we will determine our entry once we have this breakout. It is important to always consider the candlestick closure for our entry as we will decide the best buy range according to its size.
You can follow me on Twitter: https://twitter.com/armijogarcia
My profile in TIMM: https://mentormarket.io/profile/?mrbullishsail/blogposts


https://mentormarket.io/about/terms-of-service/
Would you like to trade with leverage up to X100, with bybit you can, enjoy your $60 free welcome bonus!!🤑Click here🤑 Follow my technical analysis at Binance, if you sign up with my link you get back 10% of the commissions you spend on each trade!!🤑Click here🤑 Learn to follow the price action like a professional without the use of technical indicators, in my Spanish course I teach you how to do it!!!🤑Click here🤑