A fresh wave of speculation just hit the Twitter space and it is completely reshaping global financial expectations. Elon Musk aerospace empire SpaceX is reportedly dropping hints about a massive Initial Public Offering or IPO. This single rumor is creating massive waves across the trading community because of the sheer volume of institutional capital involved.

Reports coming from Coin Bureau indicate that SpaceX intends to pitch a share sale valued at $75 billion with each share priced around $135. The real shocker here is that BlackRock the largest asset manager on the planet has already stepped in to secure a massive slice of this IPO worth over $5 billion. This aggressive institutional bidding has instantly forced other sovereign wealth funds and heavy funds to jump into the line.
The scale of this movement has forced central bankers into immediate action. Market source OxNobler revealed that the Fed is preparing an emergency injection of $25.5 billion in market liquidity right as the SpaceX IPO goes live. Former Fed board member Kevin Warsh strongly suggested that this capital injection must happen immediately to absorb the shock once the SPCX ticker starts trading on public boards. Meanwhile, financial commentator Jim Cramer shared a cautious perspective warning everyone that SpaceX valuation might skyrocket into an unsustainable bubble post IPO.
Tracking Global Bitcoin Trends
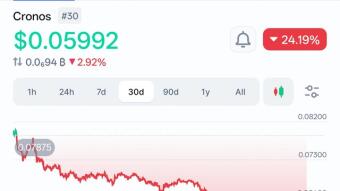
While the entire financial world watches the SpaceX IPO drama unfold, let us analyze what is happening with the king of crypto. When looking closely at spot market metrics, Bitcoin appears to be holding a steady baseline despite facing notable technical headwinds within the derivatives space.
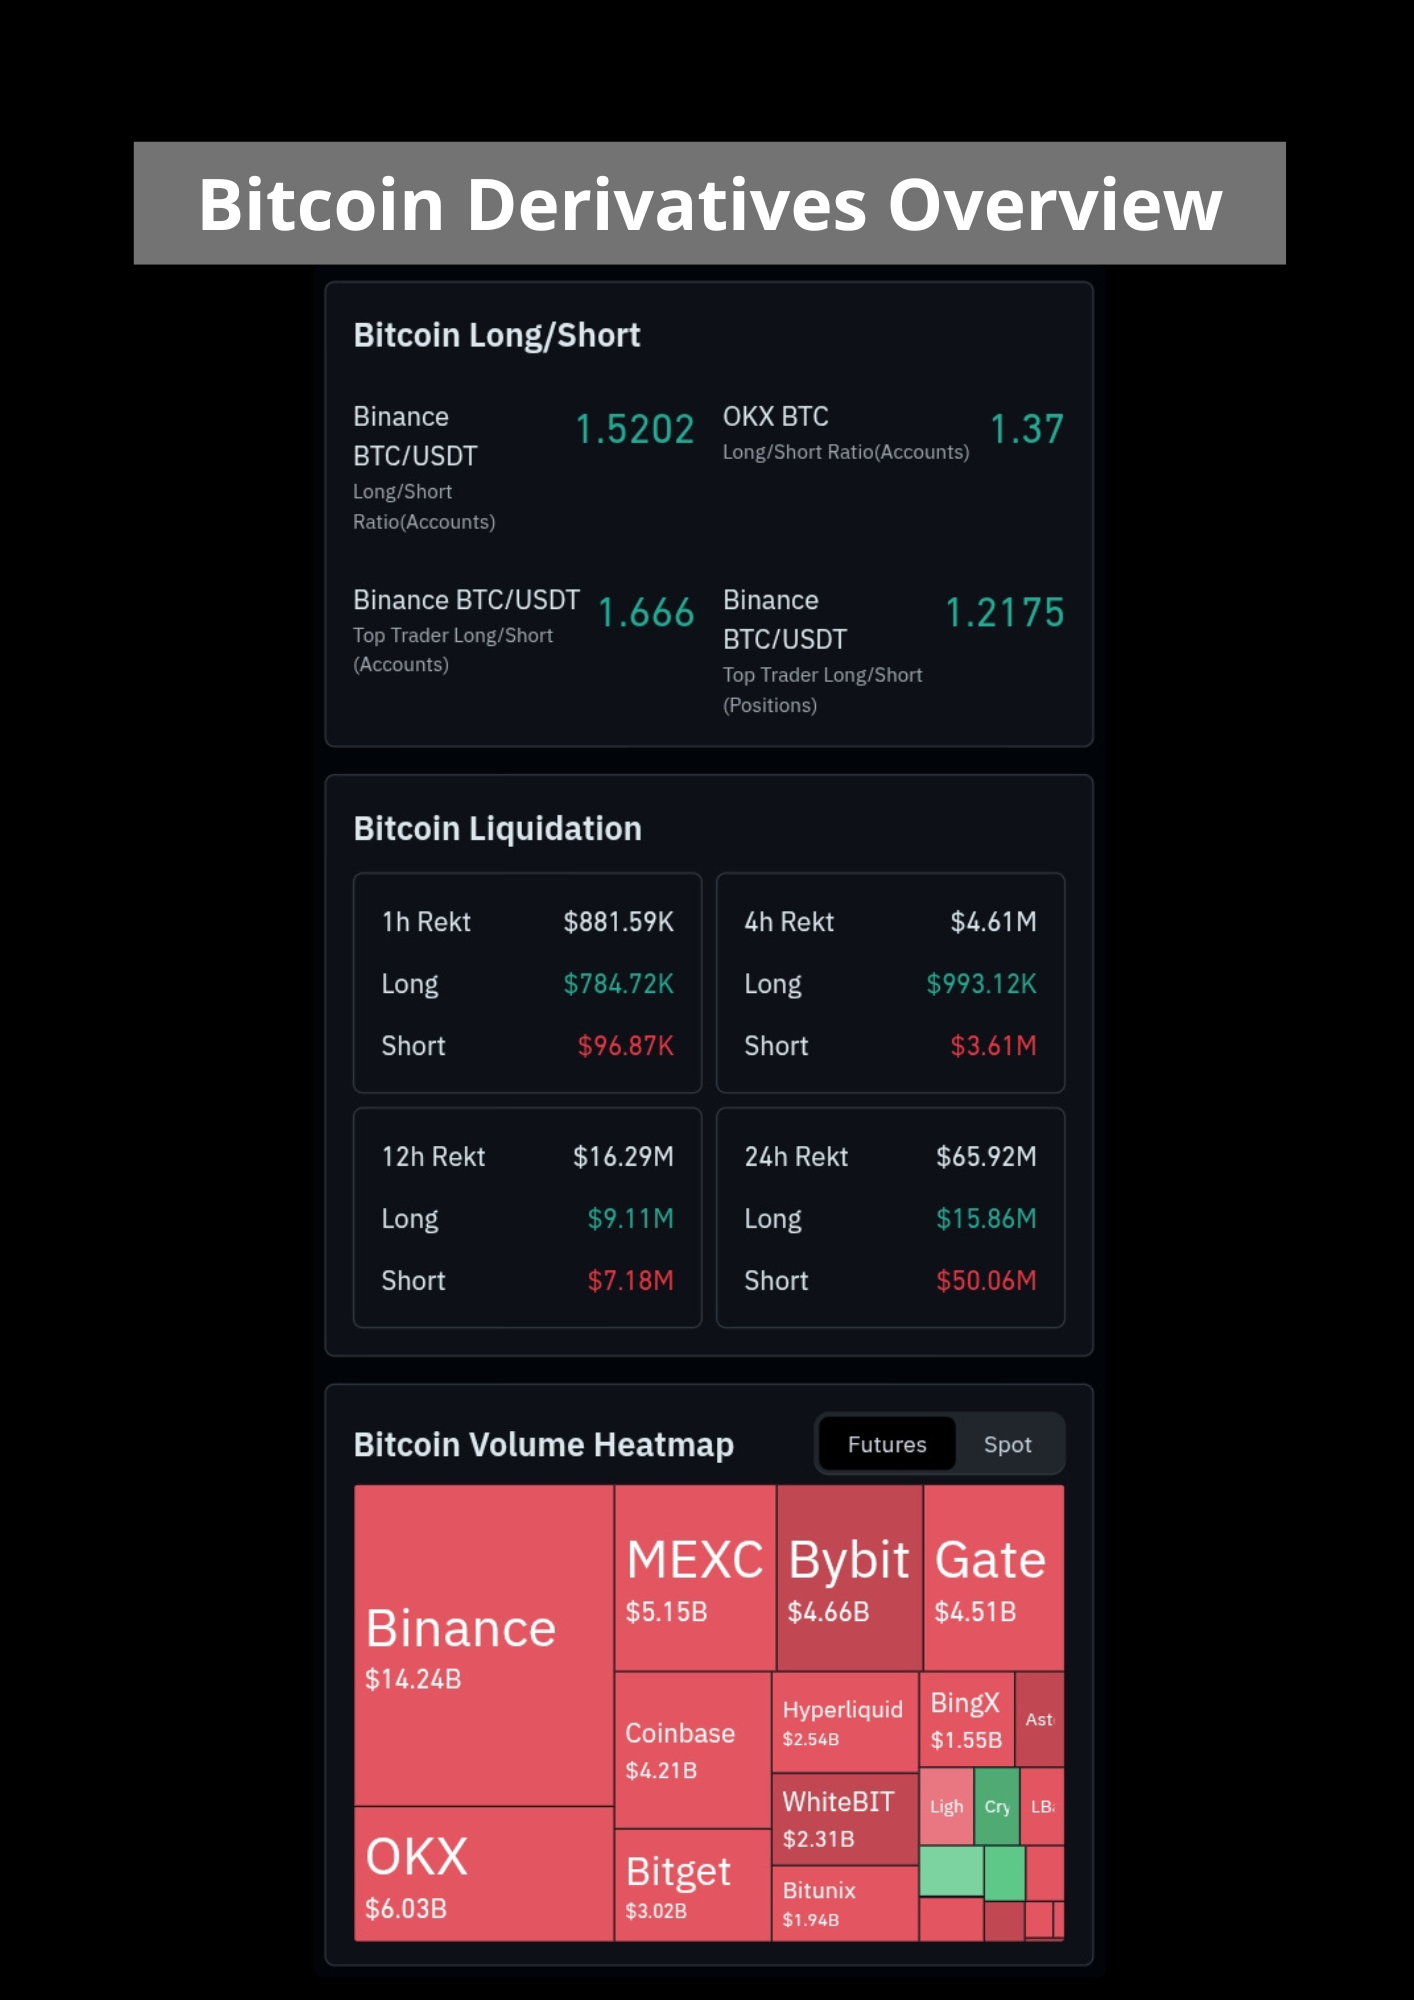
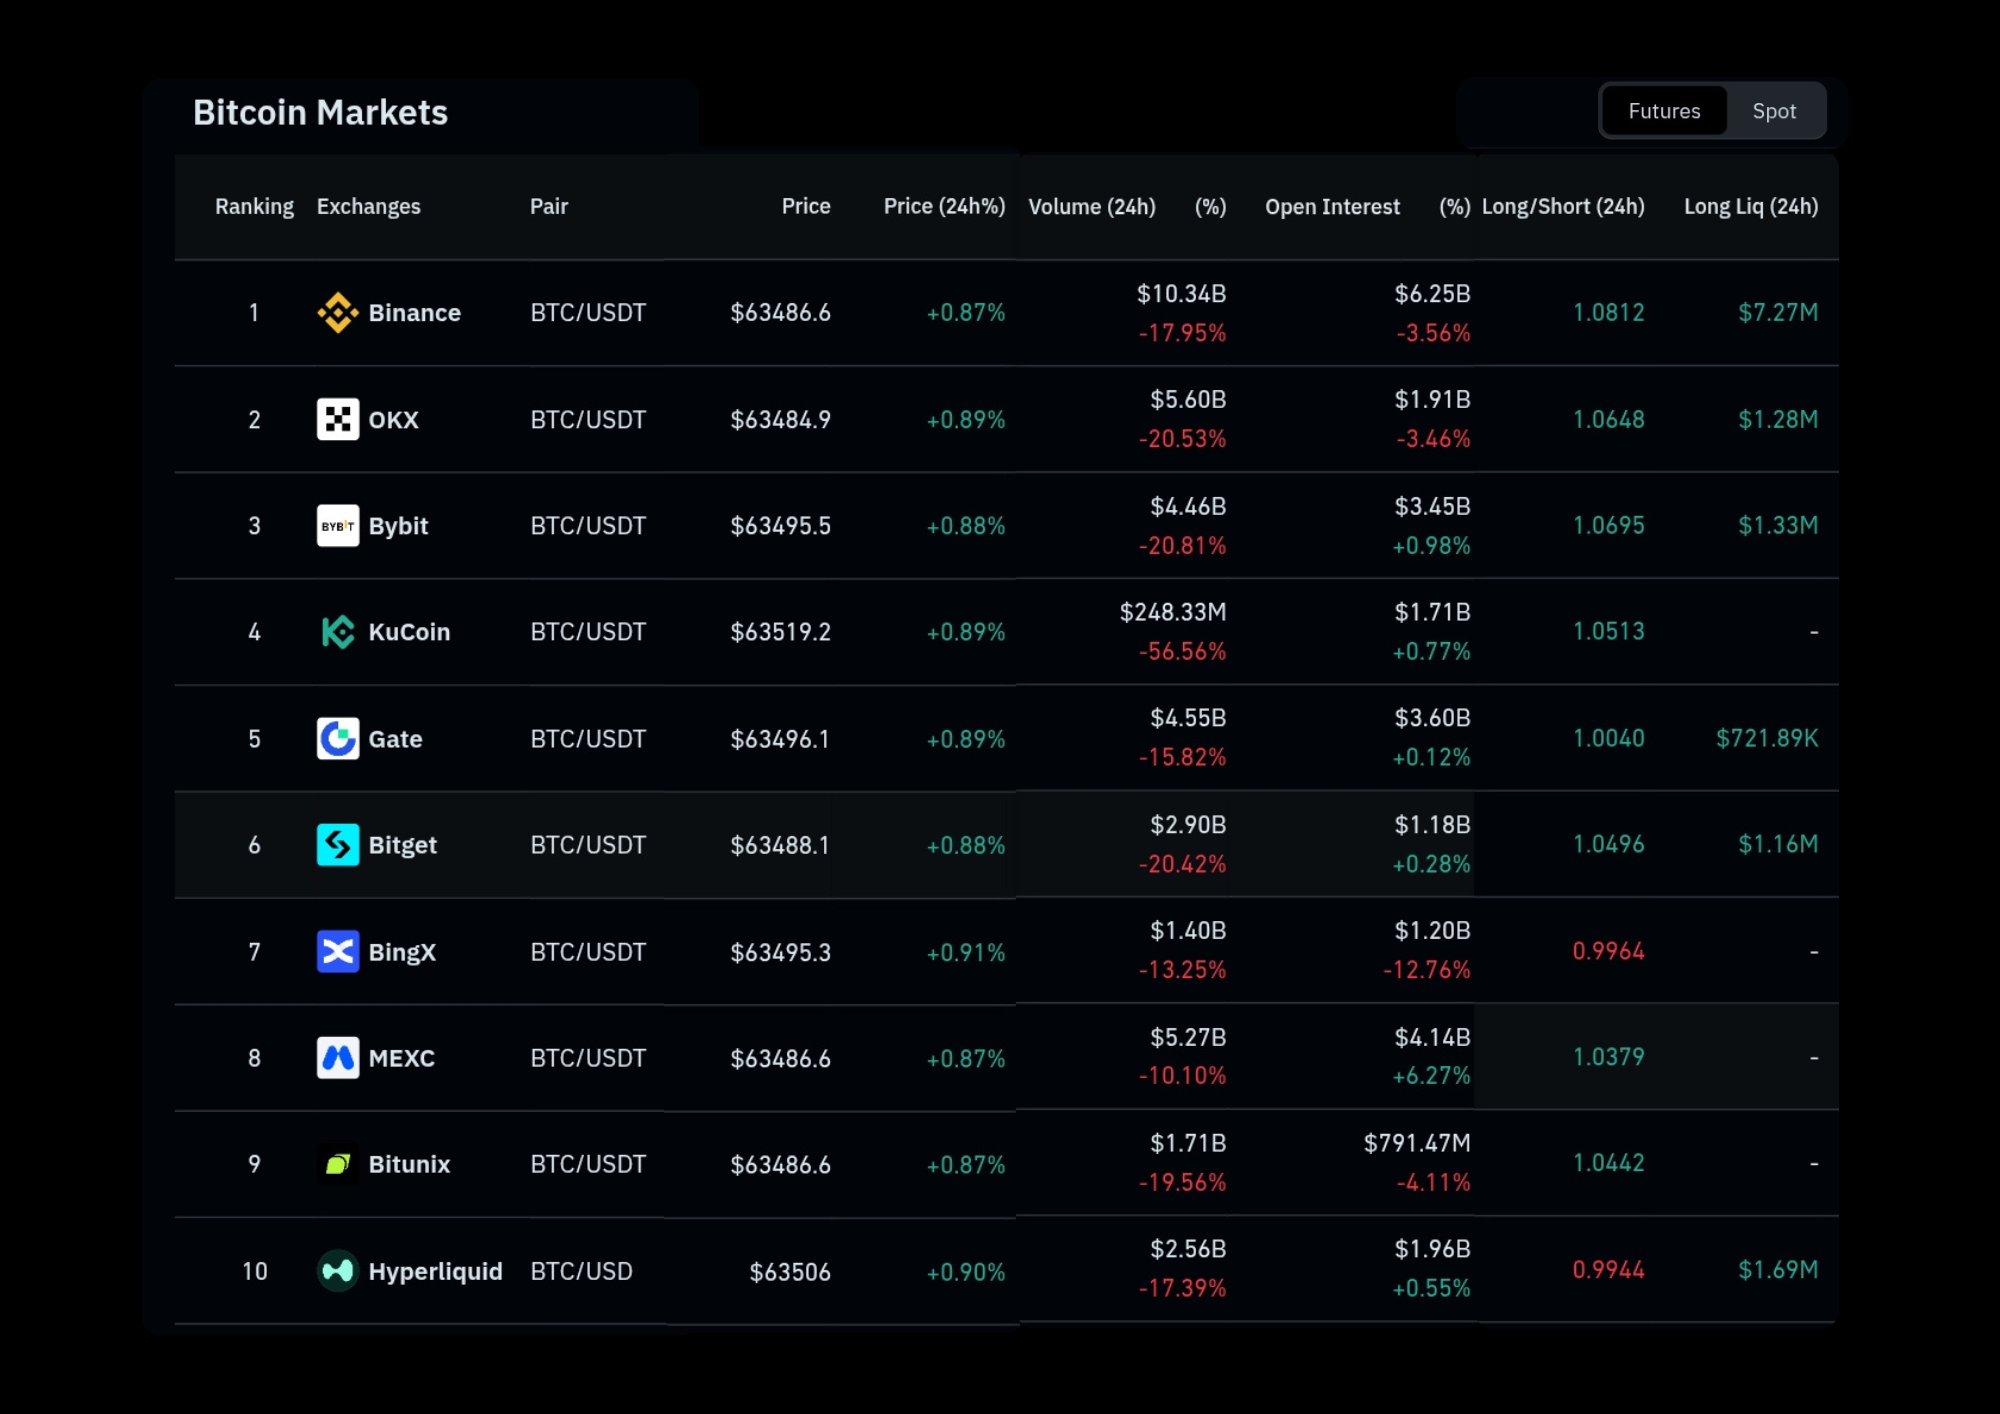
Right now Bitcoin is fluctuating within a tight range from $63.480 to $63.519 on major trading platforms. Daily volume for the BTC/USDT pair on Binance managed to reach $10.34 billion even though the overall 24 hour activity is facing a temporary drop of roughly 17.95%. Simultaneously, global open interest across the board is experiencing a minor downward correction.
The most critical data point to watch is the sudden surge in total 24 hour Bitcoin liquidations which climbed past $65.92 million. Interestingly, the worst part of this liquidation wave hammered the bears who heavily stacked Short positions resulting in $50.06 million in losses. On the other hand, daily Long liquidations stayed relatively low at only $15.86 million.
Heavy Volume On SPCX Token
Shifting our focus away from a quiet Bitcoin market, the massive hype surrounding Elon Musk newest venture ignited an absolute frenzy on crypto exchanges even before the official stock hits traditional equity markets.
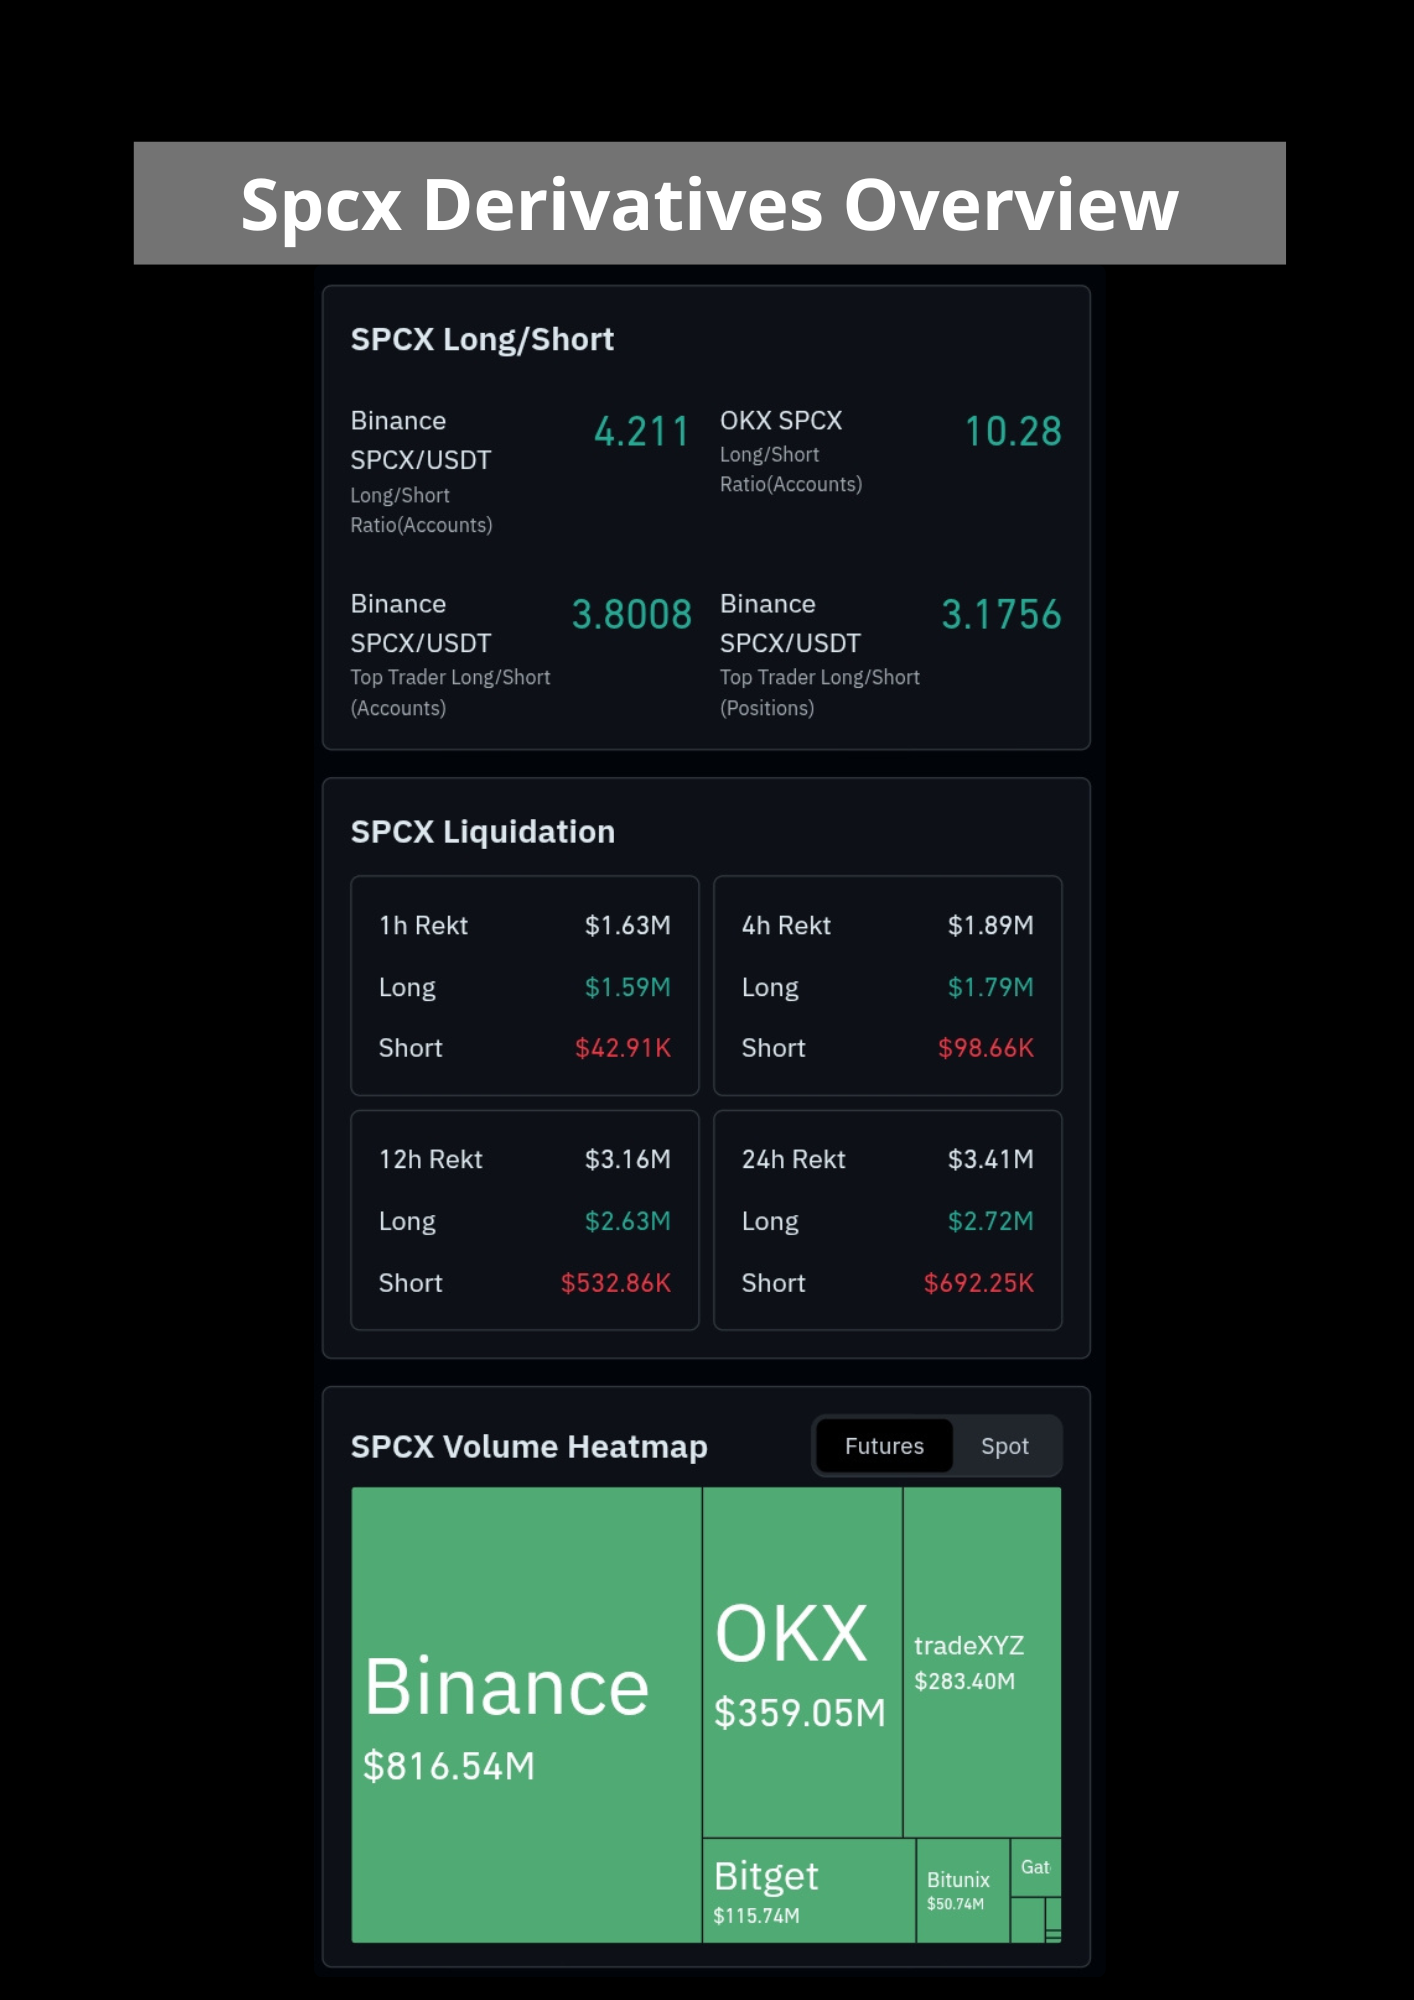
Analyzing the Long vs Short distribution for the SPCX/USDT pair reveals that buyers are completely steering the ship. Binance exchange metrics show the Long to Short account ratio pushing up to 4.211. The numbers look even crazier on the OKX exchange where the ratio pushed to an incredible 10.28. In terms of futures heatmap volume, Binance takes the lead with an impressive $816.54 million in turnover, followed by OKX at $359.05 million and tradeXYZ at $283.40 million. Total liquidations for SPCX over 24 hours reached $3.41 million with Long positions taking the biggest hit at $2.72 million.
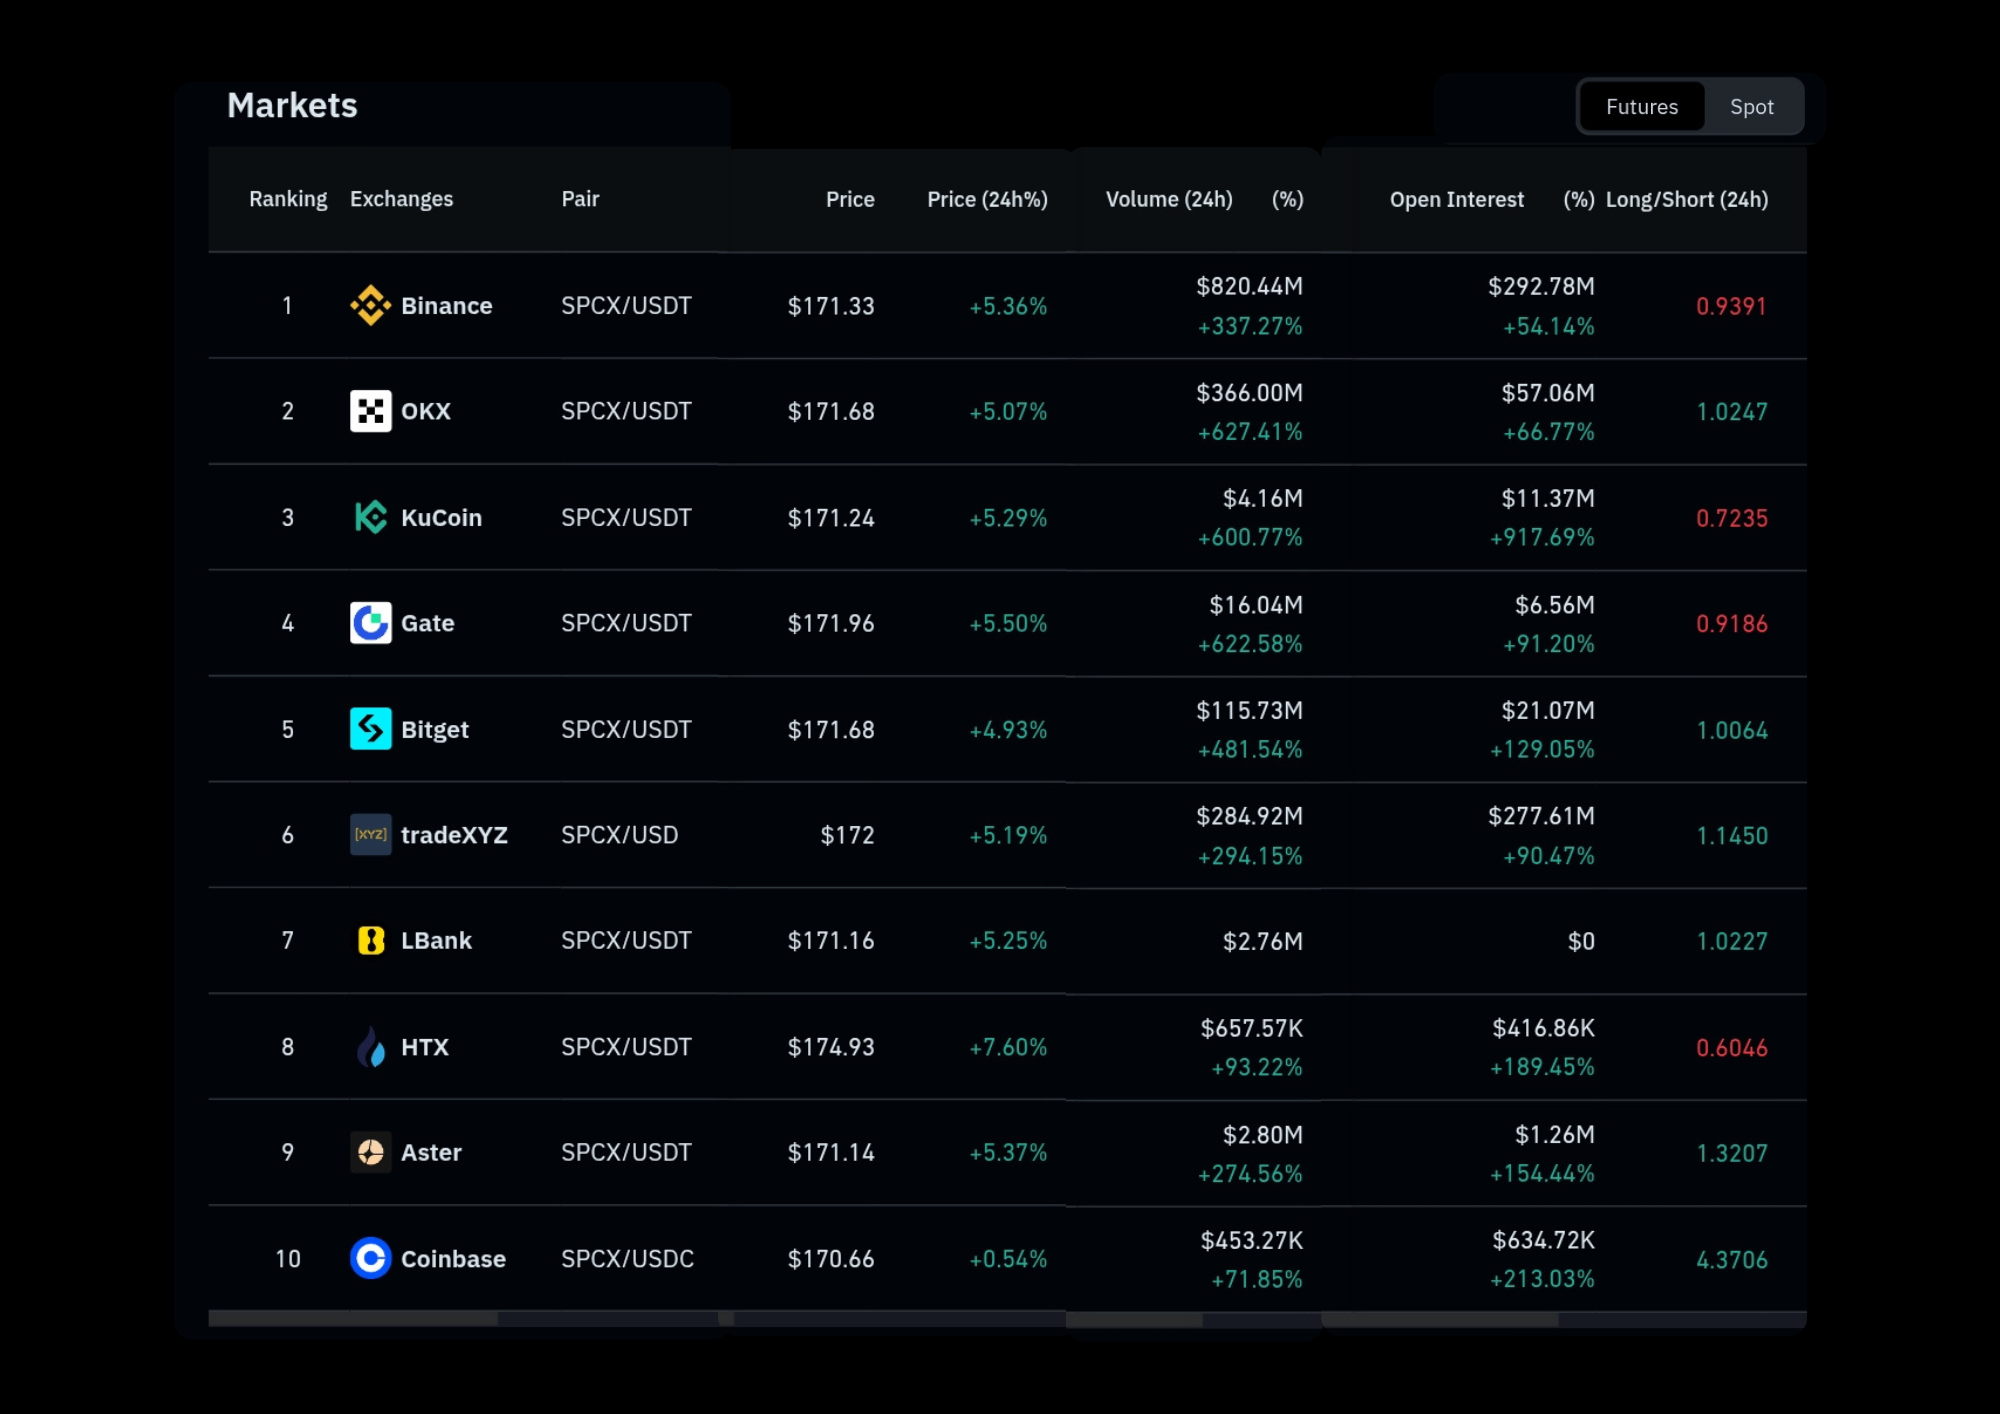
This aggressive bidding also triggered a massive spot market pump for the token. On Binance, SPCX/USDT is trading at $171.33 showing a daily increase of over 5.36% fueled by a trading volume explosion of more than 337%. OKX shows a similar bullish track reaching $171.68 which represents a 5.07% jump alongside a massive 24 hour volume surge of over 627%. Platforms like KuCoin and Gate also print prices around the $171 to $172 zone with average volume growth exploding past 600%.
My Opinion
From a trader perspective, I see this macro event as a highly strategic setup that offers a massive hidden opportunity. The fact that the Fed needs to prepare tens of billions in emergency liquidity proves that traditional finance gets heavily disrupted whenever BlackRock and other institutions rotate funds into Elon Musk ecosystem. Jim Cramer warnings about a potential valuation bubble are definitely worth keeping in mind as a risk factor. However, history shows that whenever massive liquidity enters global financial systems, high risk assets like Bitcoin eventually capture a lot of that capital inflow.
Let us map out the daily chart structure using Smart Money Concepts to see exactly what the technicals are telling us via TradingView.
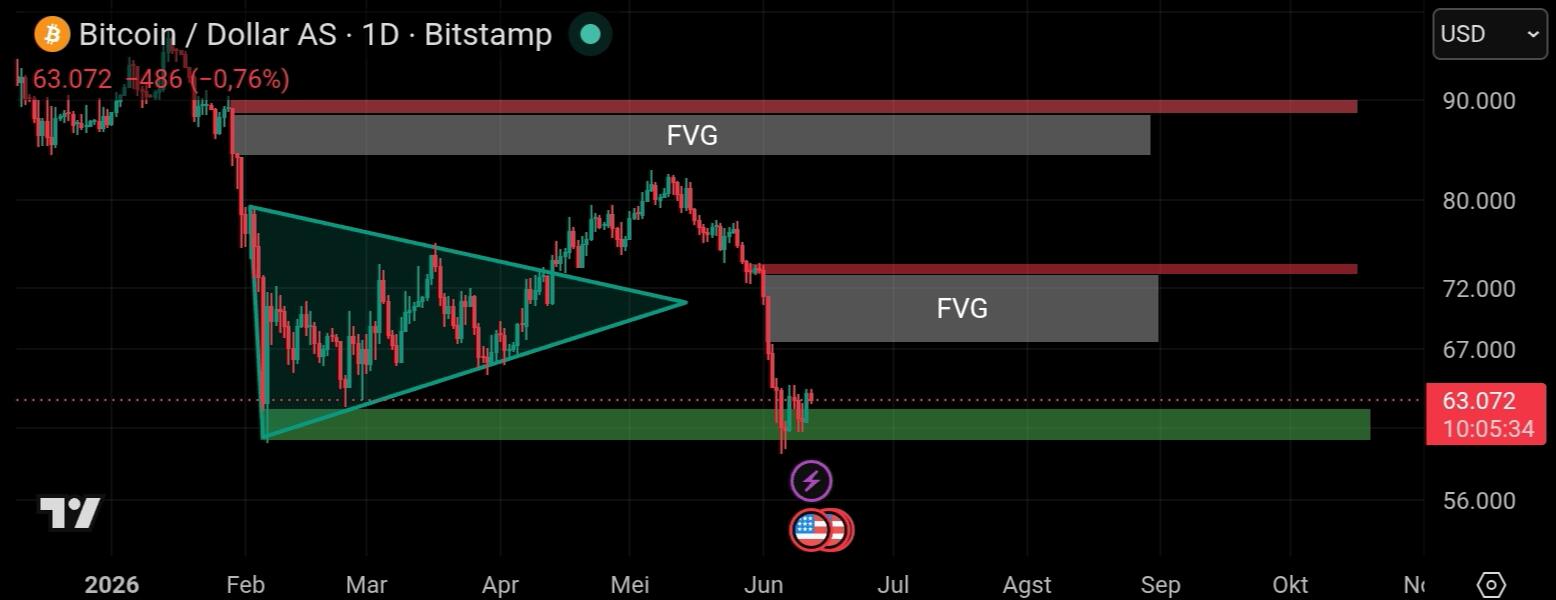
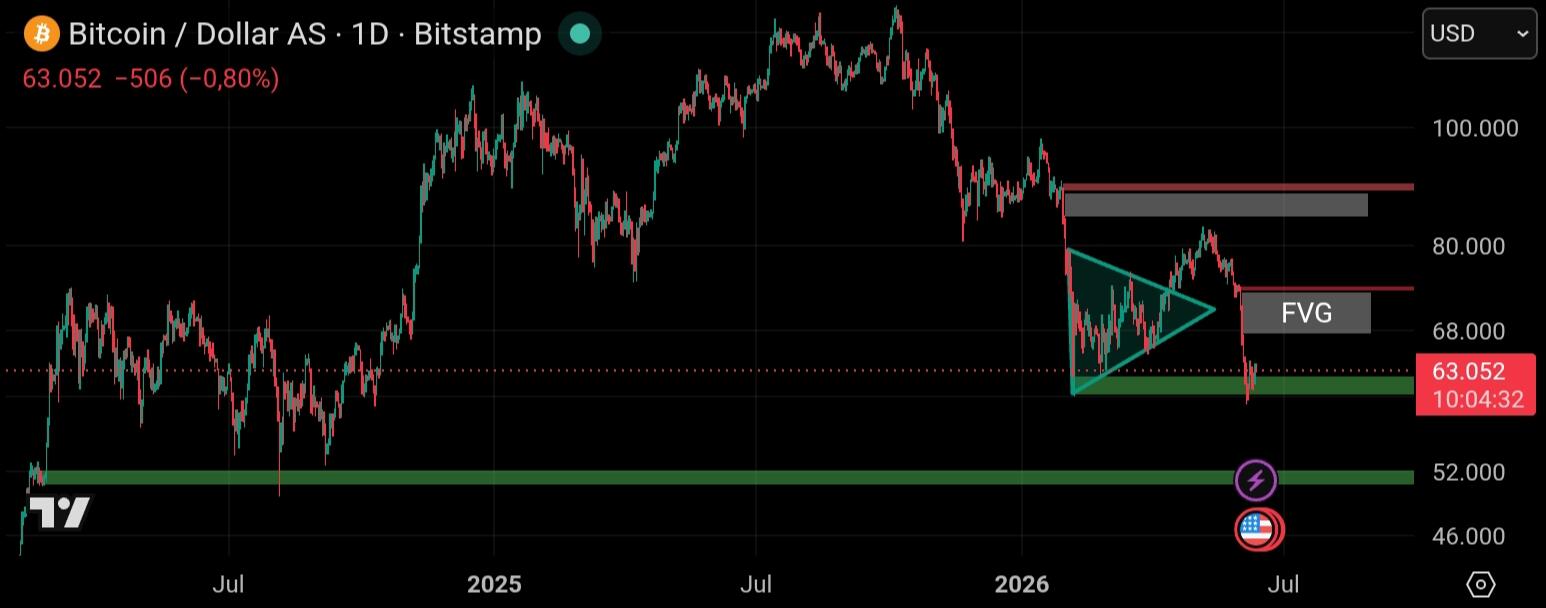
When we look at the daily timeframe, Bitcoin is currently hovering in a highly sensitive retesting zone. Looking upward, we can identify a very strong bearish block forming our ultimate resistance ceiling between $90.280 and $88.400. If buyers manage to find enough momentum to launch a counterattack, the first major barrier to break through is the secondary resistance zone sitting at $74.265 - $73.060.
The core question we need to answer is whether the current support zone at $62.560 - $60.000 will hold the line. This green demand zone is incredibly important because it is trying to absorb the sell pressure after the price recently broke down from a textbook triangle pattern. In theory, if this support floor successfully repels the sellers, the market will have a perfect environment to build a strong reaccumulation base before starting the next leg up. However, we must always respect our risk parameters. If the $62.560 - $60.000 support structure fails to hold, we should expect Bitcoin to slide lower toward the ultimate defensive cushion located around the $52.290 - $50.520 zone.
The biggest educational takeaway from this chart setup is the massive market imbalance or Fair Value Gap left behind on the way down. We have a distinct first FVG resting just below the second resistance, and a much wider second FVG resting beneath our main ceiling. Remember that an FVG always functions like a price magnet. Eventually, the market will return to fill those inefficient zones to rebalance old institutional orders.
To wrap it up, even though the ongoing liquidations might cause short term panic, the green demand zone offers an incredible risk to reward entry. As long as we stick to proper position sizing and keep a close eye on this support resistance framework, this market drop is simply a golden opportunity to position ourselves for a massive reversal toward those overhead FVG targets.
Click here to read my authentic and original analysis
Source
⛔ Disclaimer: This article is strictly for informational and educational purposes only. It is not intended as financial advice, and I do not provide any trading signals. All investment decisions are your sole responsibility. Please ensure you conduct your own research (DYOR) before making any trades.