
Introduction
When it comes to analyzing and evaluating blockchain projects, there are two main approaches: technical analysis and fundamental analysis.
Technical analysis involves studying historical price and trading volume data to identify patterns, trends, and signals that can help predict future price movements.
On the other hand, fundamental analysis focuses on evaluating the intrinsic value and long-term prospects of a blockchain project or cryptocurrency.
Mainstream blockchain data analysts tend to be more influenced by the fundamental approach. As a result, many of the metrics used in on-chain data analysis align with fundamental analysis principles. For example, metrics like the daily number of active users are indicative of the market potential and correspond to aspects considered in fundamental analysis. On the other hand, in on-chain data analysis, little attention is paid to price technical analysis. Sometimes, the daily or hourly price may be taken into account as a control variable or dependent variable, but other commonly used technical indicators like RSI (Relative Strength Index) and MACD (Moving Average Convergence Divergence) are typically not used.
This is partly because these technical metrics are not as intuitive as other behavioral and performance metrics, and partly because understanding and creating SQL queries for them can be challenging.
Here I introduce a dashboard which aims to provide you with the foundation of queries for fundamental analysis. It can be as a toolkit for integrating fundamental price indicators into your blockchain on-chain data analytics. You can combine some of the prices metrics with other behavioural and performance metrics to evaluate a project or cryptocurrency.
The dashboard is built on Flipside App.
Technical Indicators Toolkit
Technical Indicators
This dashboard presents four major technical indicators:
- Basics: The charts display the price over time and the percentage change in prices.

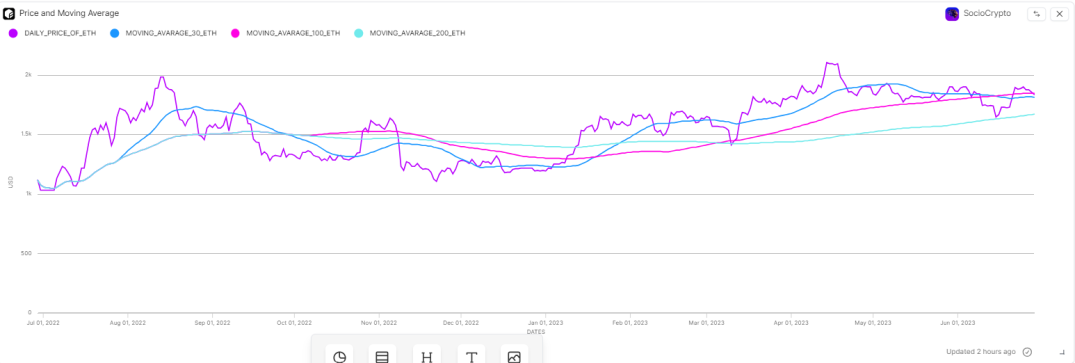
- Moving Average and MACD (Moving Average Convergence Divergence): These indicators provide insights into trends and potential market reversals.
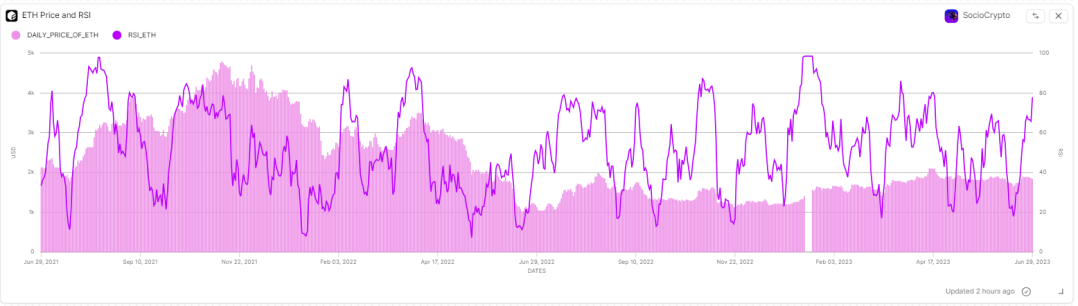
- Relative Strength Index (RSI): The RSI indicator helps assess whether a cryptocurrency is overbought or oversold.
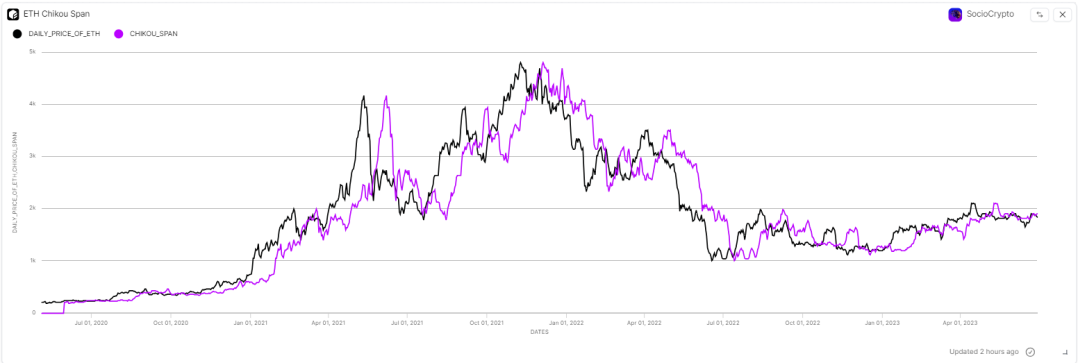
- Ichimoku: The Ichimoku indicator offers a comprehensive perspective on support and resistance levels, trend strength, and potential future price movements.
All the charts in this dashboard are specifically created for tracking the price of Ethereum (ETH) on the Ethereum chain. However, in the near future, the dashboard will be enhanced to allow parameterization, enabling the charting of any ERC20 token.
By combining these metrics with conventional ones, you can gain additional insights into your analysis. Sometimes, the behavior of traders and a significant portion of the market is influenced by technical analysis and these metrics. Therefore, untangling these effects can be crucial in on-chain data analysis and without considering these metrics the picture you provide is incomplete.
For more information on the technical indicators and detail of queries check out the dashboard on Flipside app:
Technical Indicators Toolkit
Note: To access the SQL Queries provided in this dashboard, you need to log in to Flipside's app. Flipside is a leading on-chain data provider that offers a wide range of on-chain data, analytics and other useful analytic tools.
More about the Author
Twitter: @SocioCrypto
Discord: SocioCrypto#1741
Flipside Profile: https://flipsidecrypto.xyz/SocioCrypto


