This post examines ETH/USD price and volume movement from Jan-01 to Feb-25.
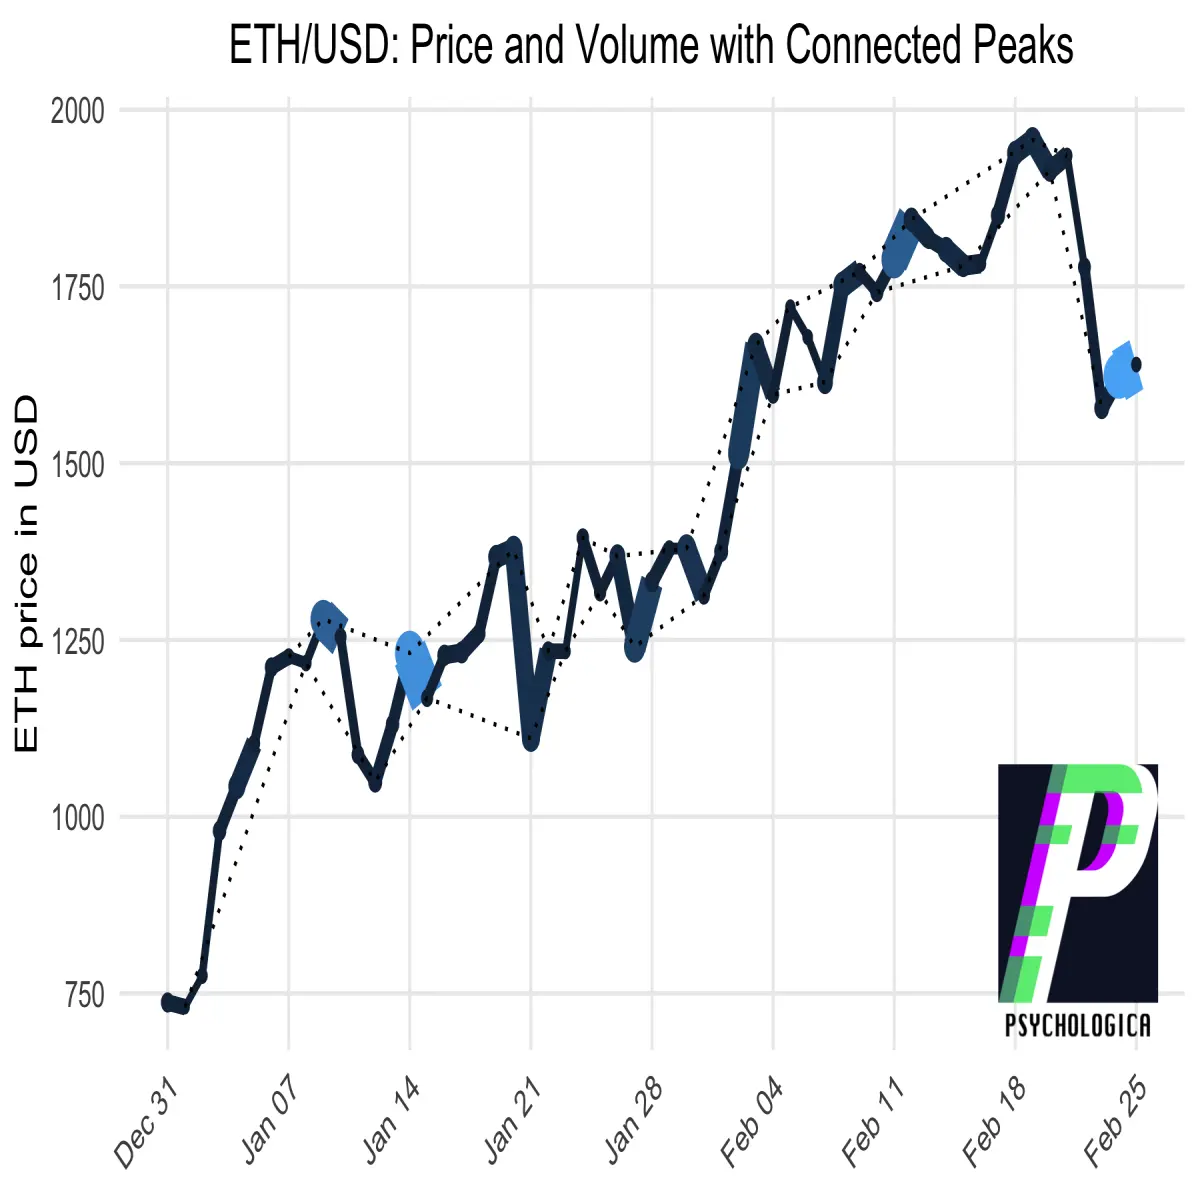
2021 began with a rapid, low-volume drive from 750 USD up to 1250 USD, followed by a large volume of selling around 1250 USD in the second week of January.
Throughout the remainder of January, ETH/USD oscillated to consolidate around 1300 USD. From January 20 until February 1, there were medium-volume movements bouncing within a fairly narrow price channel less than 200 USD wide.
February started with a rapid jump to 1500 USD, which was confirmed by a substantial volume entering the market even after reaching 1500 USD.
The second week of February saw even more large-volume movement, which pushed ETH/USD up to 1750 USD.
After some lower-volume disagreement, ETH/USD topped out around 2000 USD before a low-volume crash back to 1650 USD.
In the final week of February, we see very high volume around 1650 USD, suggesting lots of ETH is changing hands at this price.
More Research from Psychologica
- ADA/USD Market Structure
- LINK/USDT Market Structure
- BTC/USD Market Structure
- BTC and ETH animated against USD
How to read this plot
This plot depicts the movement of ETH quoted in USD, for the year 2021 to date.
The width of the line is proportional to the volume traded during that period. Similarly, lighter colors correspond to higher volume.
The peaks and troughs have been identified. Peaks were connected to form channels containing most of the price action.






