
Hello and welcome to today's price analysis. After last week's analysis, I got a lot of comments about people saying they don't trade only bitcoin. The most requested coins were ETH and BAT, so this analysis includes them as well.
As is usual with my price action analyses, we'll be looking at what price did today, and what they might do tomorrow.
I personally trade inverse swap contracts on ETH and BTC, so I'll be using those charts here. Please signify in the comments if you wish to learn how to trade perpetual inverse swap contracts, and I'll direct you to my personal contacts to further the discussion.
Ok. Let's start with BTC:
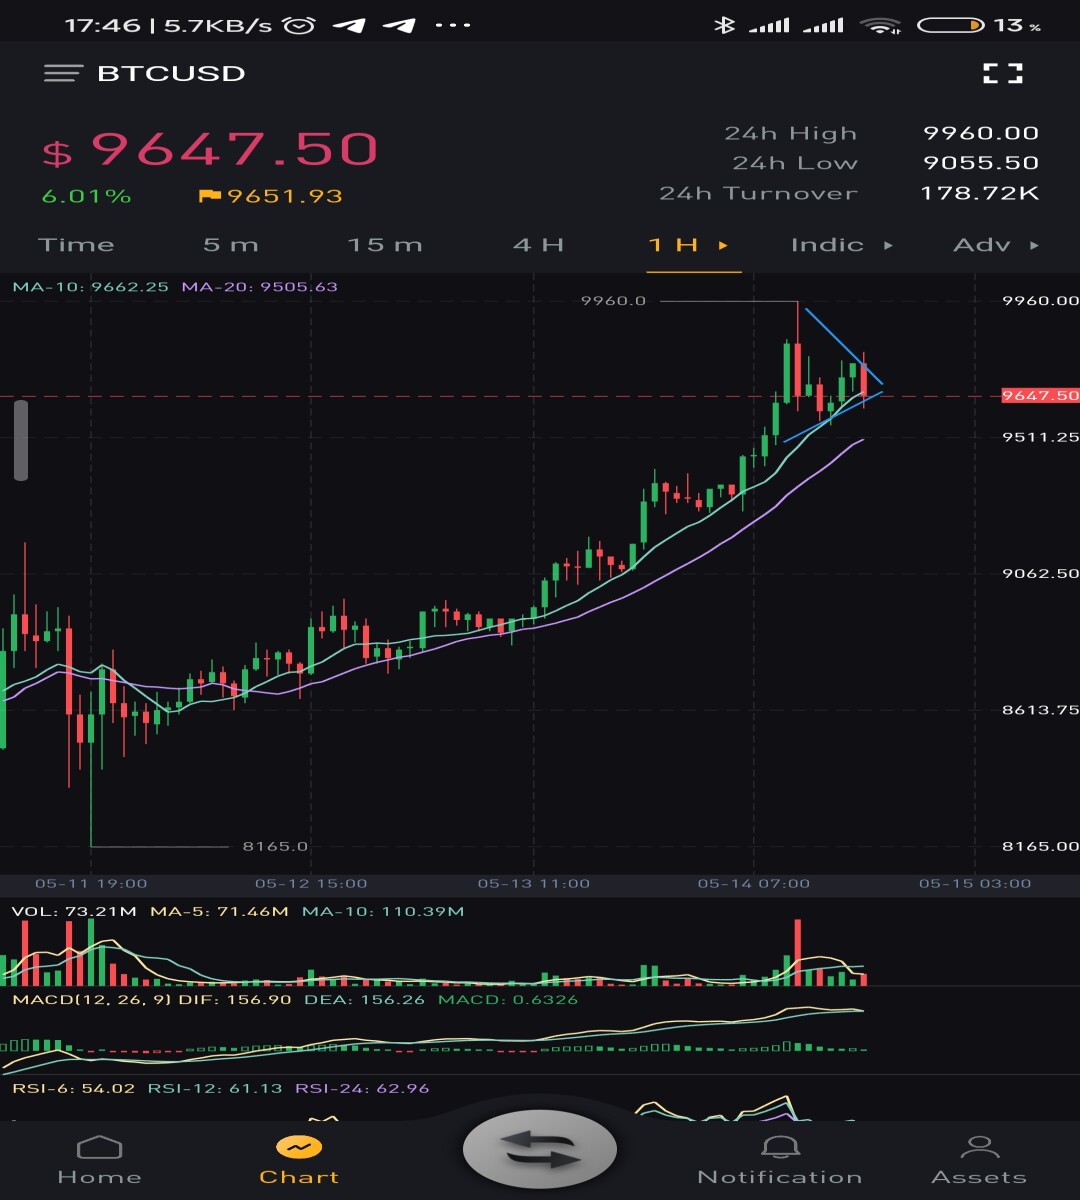
Above is a price chart from Bybit.com, where I trade such contracts. This is the hourly chart.
If you read my analysis from yesterday, you'd remember when I said that price needed to break and flip the overhead resistance before being able to rally. I also said that I'd look for entries around the 8787 region.
Well, I got my contracts filled, and with 100x leverage at that. I was somehow miraculously able to catch the very top of the move, and that resulted into a 600% profit (with 100x leverage, I do not recommend beginners use this)
What do I see for tomorrow? Well, as I have aptly denoted on the chart, I see a wedge forming. It isn't perfect in any way, bit I expect a retest of resistance, and possibly a flip on the breakout of that wedge.
Should that wedge fail however and break down, 9.2k is our next support, which was previously a resistance.
Now, on to the $ETH chart. The below chart a daily chart, equally obtained from Bybit.
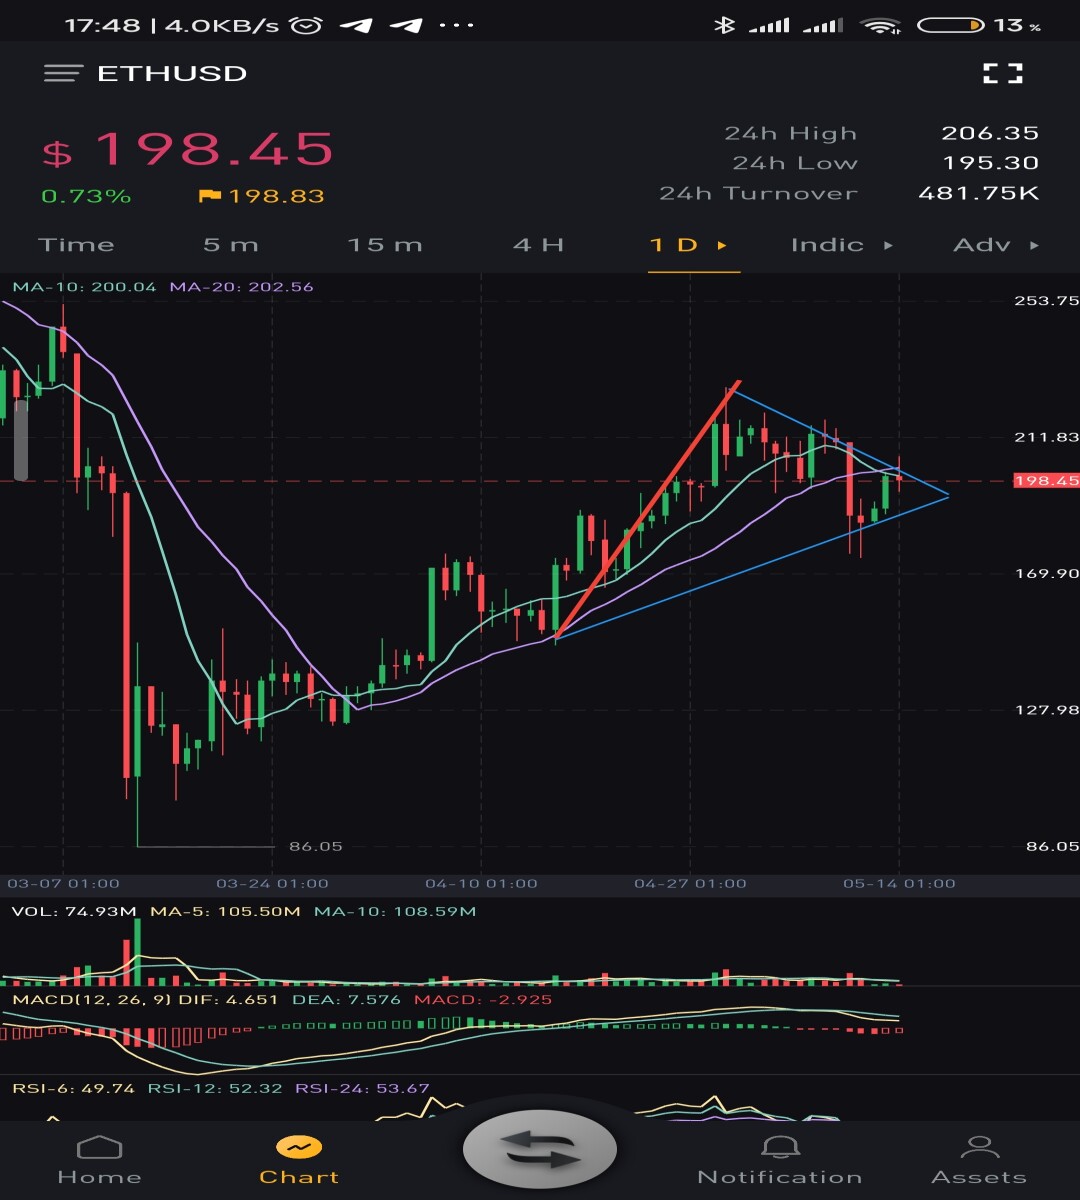
The daily timeframe, I believe, is a better way to understand ethereum's actions, simply because of its weird behaviour of late.
As I have aptly drawn on the chart, we can also see a wedge forming on the daily timeframe. Wedges forming on said timeframe are more reliable than others.
I'm expecting this one to breakout to the upside, just like BTC. However, if bitcoin breaks down, it may spell bad things for ETH.
Lastly in the analysis, we have $BAT. Below is a price chart showing the price movements of BAT every hour.
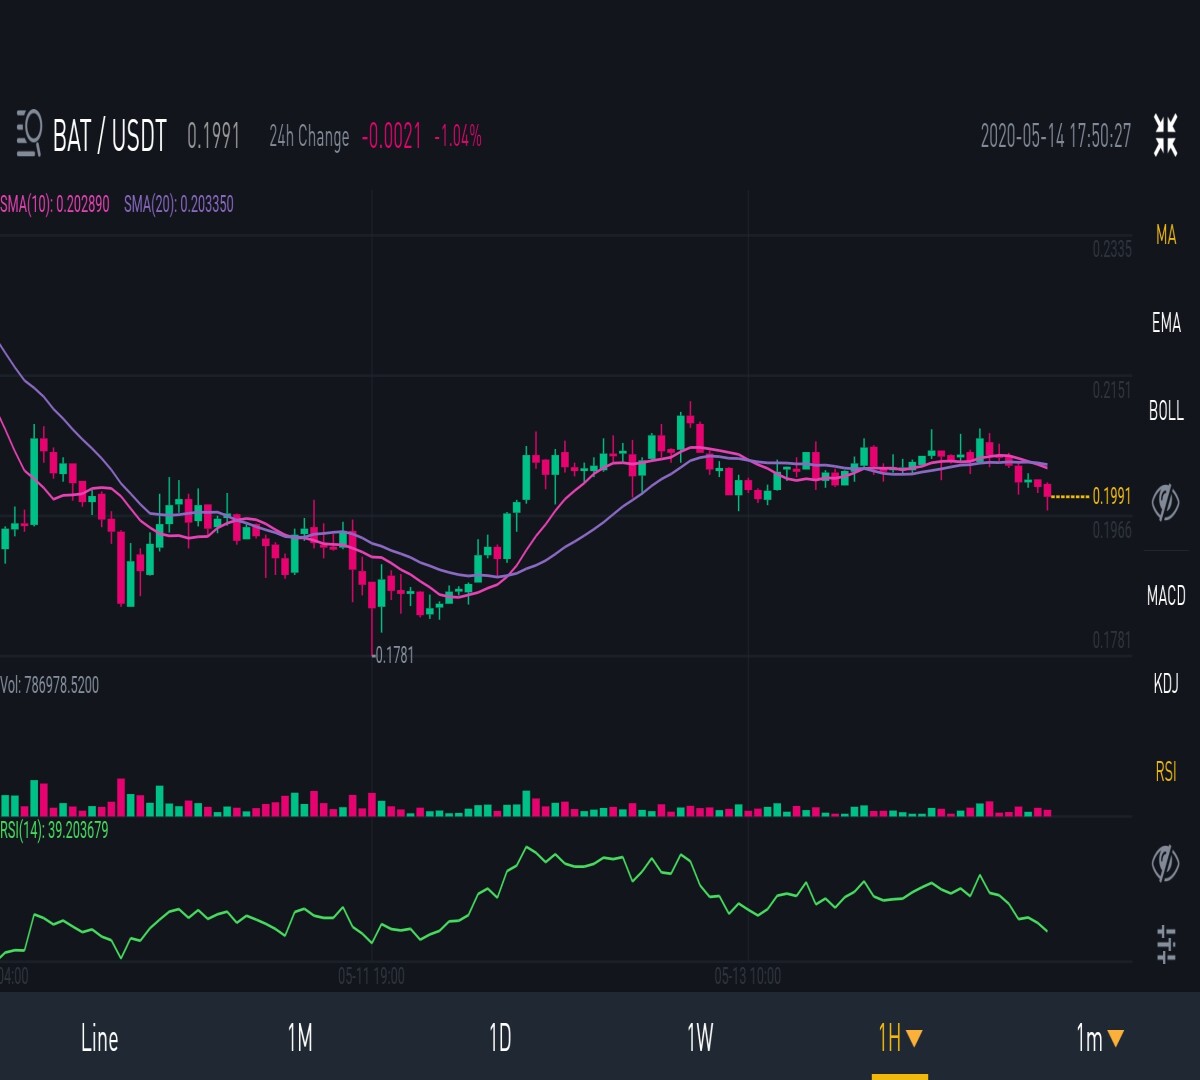
There's really nothing much to say about BAT right now. It's trend is unclear, and although it's on my list of cryptocurrencies to collect bags of, I wouldn't touch it right now, given the strength of bitcoin and his brethren.
However, for the sake of analysis, let us look closer at the graph.
The price is currently below the 10 and 20 MA, which is bad news. Equally, it's below the 100 and 200 day MA(although you can't see that here), and volume is dwindling. Equally, the RSI is undecided as to whether it's oversold or not. We must wait for further clarification before entry.
Thanks for reading. As always, this isn't financial advice. Accumulate your favourite cryptocurrencies for free here.


