
Hello people, we are here again for another study, let's get to these exciting results!
Here again are the buy and sell tickers on Binance.
In the last article I talked a little about the methodologies I use, but I will remind you for those who are new, I use supply and demand zones to guide my trades and bring me more assertiveness. If you feel the need to know more about my methods, reading the previous one is a good idea.
Now, let's move on to the graph. Grab a coffee, a pencil and a notebook, you'll definitely want to write this data down.
DOGEUSDT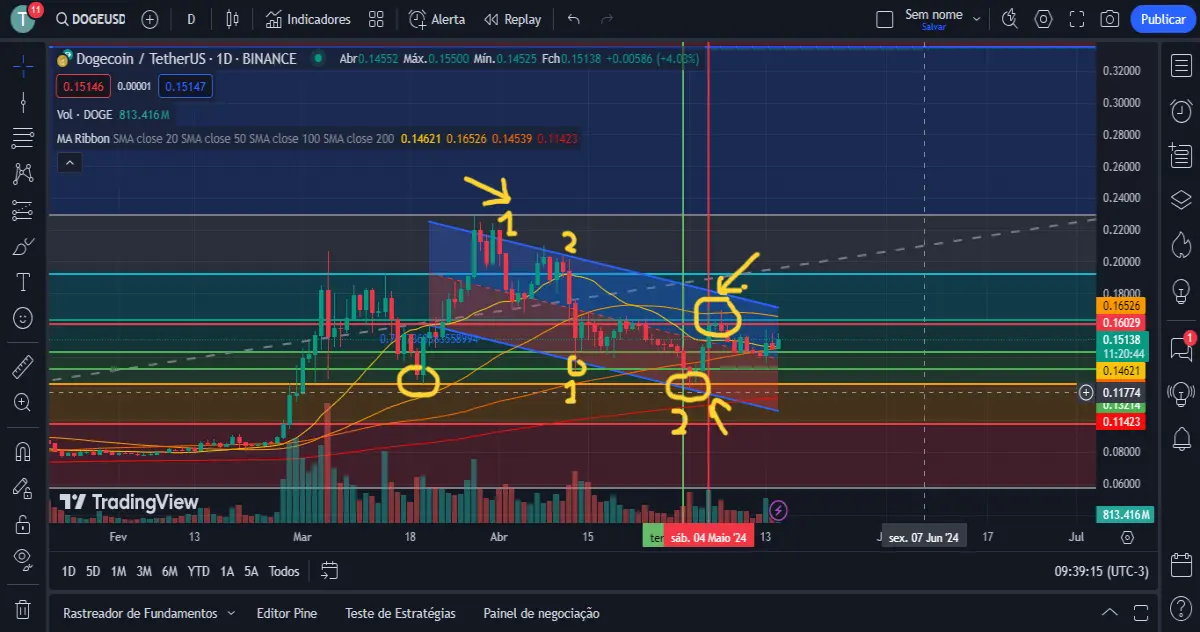
Green lines, purchase;
Red lines, sale.
Firstly, I would like to highlight the key points when looking at this graph:
- Doge comes from an increase of more than 130% in 31 days between February 26th and March 28th.
- The areas marked 1 and 2 on the chart demonstrate a falling zone characterized by descending tops and bottoms, forming a descending channel.
- Fibo: 1.000 (0.22888);
0.786 (0.19205);
0.618 (0.16314);
0.500 (0.14283);
0.382 (0.12252);
0.236 (0.09740);
0.000 (0.05678).
Starting to analyze the trade.
Upon noticing the strong drop (day 30, start of the trade), I remember that I looked at my cell phone and saw a drop of 9% on the day in Doge, I ran to the computer to see what was happening, after all, after the trader in Solana was waiting for a new position. Remembering that Doge had already been falling for 7 days, totaling ~(-19%-18%).
When you notice this sharp drop, can you really go into decline? The answer is yes, if you know what you are doing. On the chart we were approaching the bottom's downtrend line. In line with this, we also had the Fibo approximation of 0.382. You may be wondering, but there was a long way to go for an entry, since 0.382 is at the price of 0.12252. Yes, my dears, I would like to remind you, operating in zones prevents risks, including those of you not entering into the operation because the market has not priced it correctly (accurately). Another factor for entry, the minimum price (0.13024) of the drop on April 13th. So notice all these things, I use them to avoid market noise.
Now, everything was done, all we had to do was rest and wait to reach the high areas of this descending channel.
The unexpected thing was the high purchase volume in 4 days, which took us to the 0.618 Fibo zone, which meant that I not only reached my target of 20% but reached +21%. To exit the operation, we also need to identify the approach of the high zone of the descending channel and the appreciation value whether or not it beat the previously observed devaluation, and as we observed, it was a success.
We'll stop here with this beautiful chart and trade. I wish everyone good trades and good business.
Support me in becoming a better analyst for all of you.
For negotiations, classes, or analysis contact me on LinkedIn: www.linkedin.com/in/thiago-f-a1094a93/
Donations for this young analyst.
BTC: 12uJuXTqRUMQTCLxgW5NSHUcwQWNW4WwDW
USDT or TRX TRC-20: TJg2wFrdXsDPLLLeqXKuxcCA9RAvqpfbUk





