
The bigger picture:
In my previous post:
https://www.publish0x.com/moon333/ripple-xrp-mid-term-analysis-xrp-has-formed-bullish-crab-pat-xjykyk
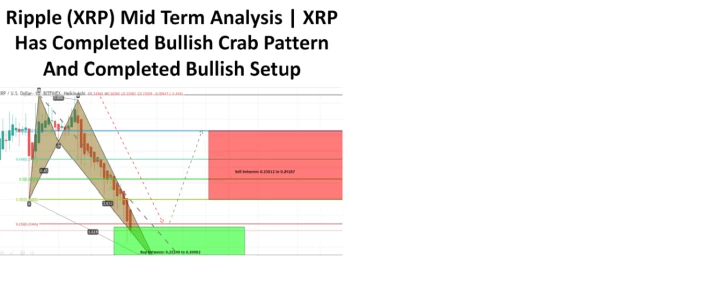
We have seen that the price action of Ripple / US Dollar has formed a bullish Crab and so far the price action is still moving within the potential reversal zone of this pattern.
This time the priceline has formed a parallel channel within the potential reversal zone of this shark pattern and likely to form a 3rd bottom at the support of this channel:
https://www.tradingview.com/x/FiaTjqTr/
The Indicators and Oscillators:
On daily chart the Relative Strength Index (RSI) has entered in oversold zone with the value of 29.45 this is the second time it is visiting the oversold within a month before this it was oversold with the value of 16.86 on 25 Nov 2019 but at that time the bollinger bands was moving steep down and this time the bollinger bands is squeezed and side ways which is a good indication.
On 25 Nov the moving average convergence divergence (MACD) was in bear cross and histogram was showing strong bearish trend and this time the MACD is in bull cross and histogram is showing weak bullish trend soon it can be changed to strong bullish trend.
The Stochastic is in bear cross and it may visit the oversold once more in the meanwhile the price action can move sideways.
https://www.tradingview.com/x/lYjQ9xIV/
Harmonic within harmonic:
Now withing this potential reversal zone of previous Crab pattern and in this channel the price action has formed another harmonic pattern and this time it is bullish Gartley pattern now lets see how this pattern is perfectly driven:
After intitial leg which is started from 25 Nov's candle stick the A to B leg is retraced between 0.618 to 0.786 then B to C leg is projected between 0.382 to 0.886 projection area of A to B leg (ignoring the spike) then sofar the C to D leg is retraced between 0.618 to 0.786 Fibonacci which is perfect as required for bullish Gartley and now we are in potential reversal zone of this gartley so on bigger pitcure we are in potential reversal zone of bullish Crab pattern where the price action has capacity to take almost 40% bullish move and on smaller picture the price action is in PRZ of bullish Gartley pattern with capacity to take bullish divergence upto 9 percent move.
https://www.tradingview.com/x/hD2xwmUq/
Now according to both patterns we can set our buying and sell targets as below respectively:
The bigger Crab pattern:
Buy between: $0.23249 to $0.20982
Sell between: $0.25012 to $0.29287
The smaller Gartley pattern:
Buy between: $0.21457 to $0.20929
Sell between: $0.21873 to $0.22870
I am also sharing the tradingview's link below where you can follow my other trading ideas as well.
Regards,
Atif Akbar (moon333)





