
Hi friends hope you are well and welcome to the new update on Theta and Theta fuel tokens. Few days back I posted an Idea where the Theta and Tfuel tokens were forming different harmonic patterns.
Now both tokens have completed their final legs and after entering in the potential reversal zone of harmonic patterns they are geared up. Theta token is surged more than 33% but this pattern is still in process and the price action is moving towards the sell target zone. On the other side Tfuel’s idea has been executed completely and it is entered in the sell target zone as per prediction and produced more than 108 % bullish rally so far. So in today's article, we will discuss about Theta fuel token’s idea that has been executed successfully.
Tfuel with USD pair the formation of bullish BAT pattern:
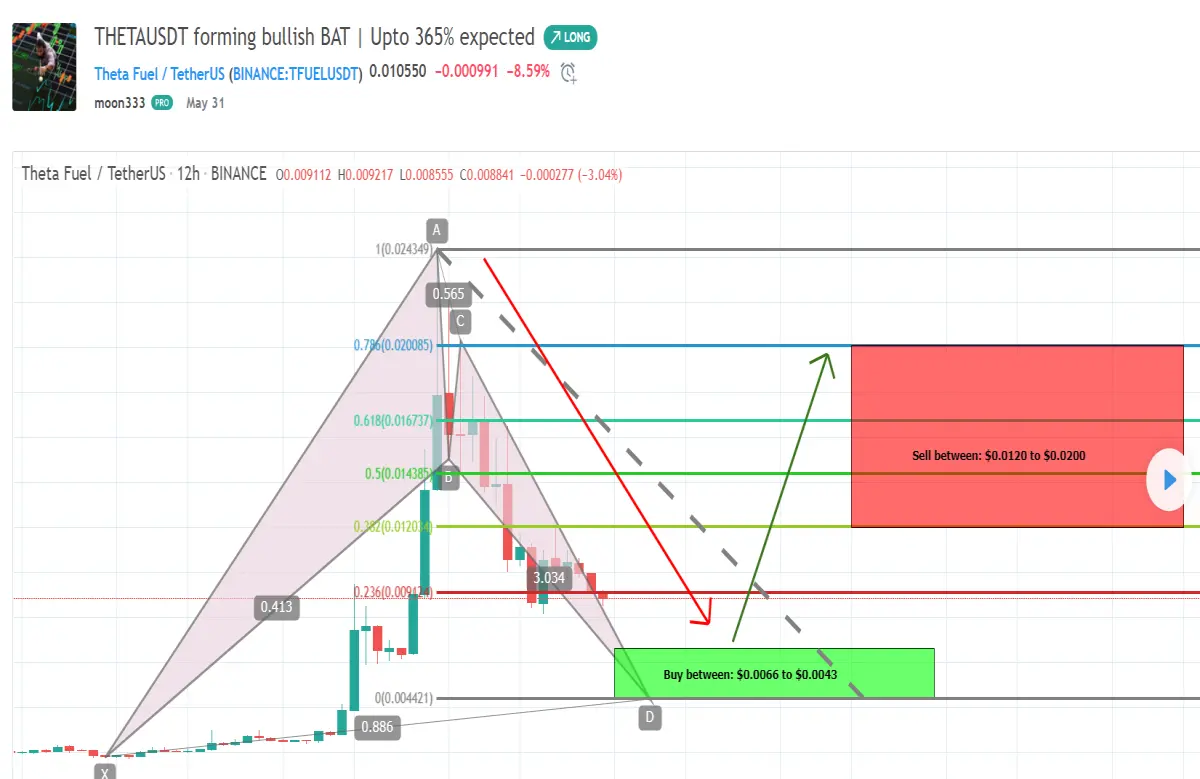
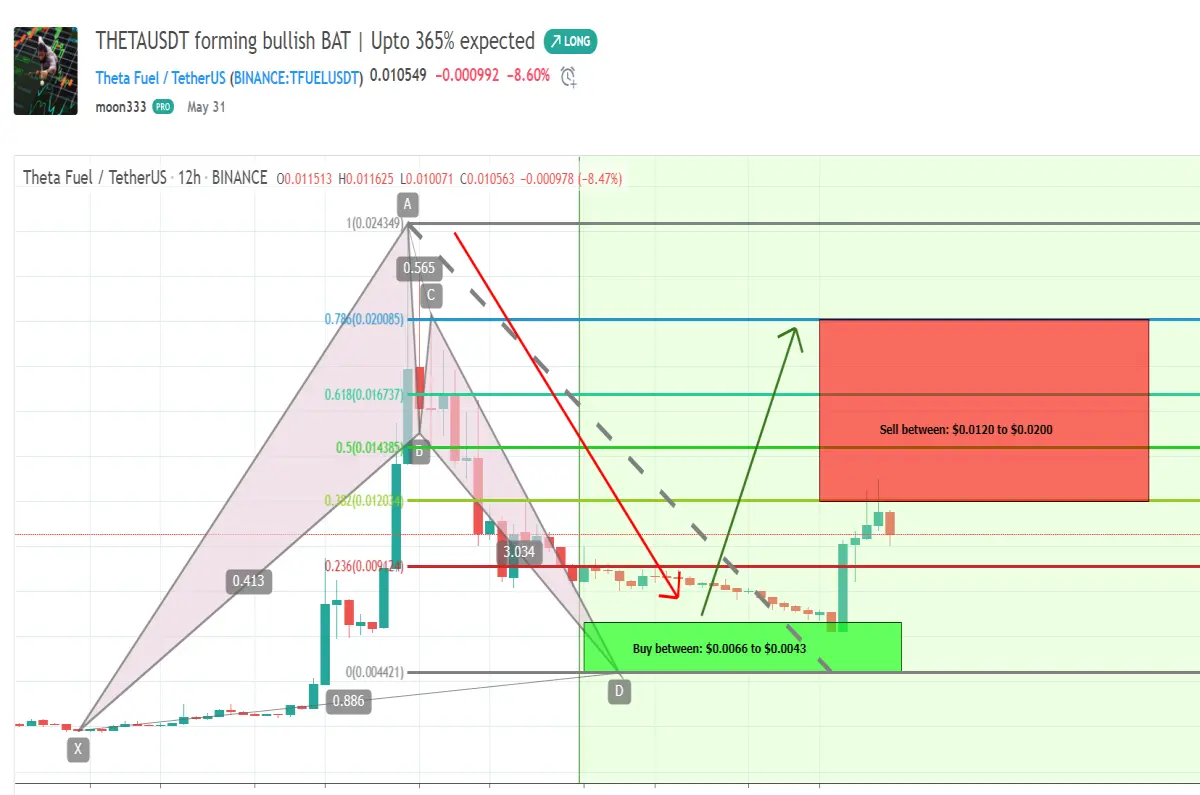
On 12 hour chart the Tfuel token was forming a harmonic bullish BAT pattern and finally after entering in potential reversal zone it took a powerful bullish divergence and reached up to $0. 012990 and produced more than 105% so far. The buying and sell targets were as below:
Buy between: $0.0066 to $0.0043
Sell between: $0.0120 to $0.0200
Tfuel with USD pair bullish BAT before execution:
Tfuel with USD pair bullish BAT after execution:
Click here to visit this old article on tradingview
You can also watch below video for better understanding
Tfuel with BTC pair the formation of bullish BAT pattern:
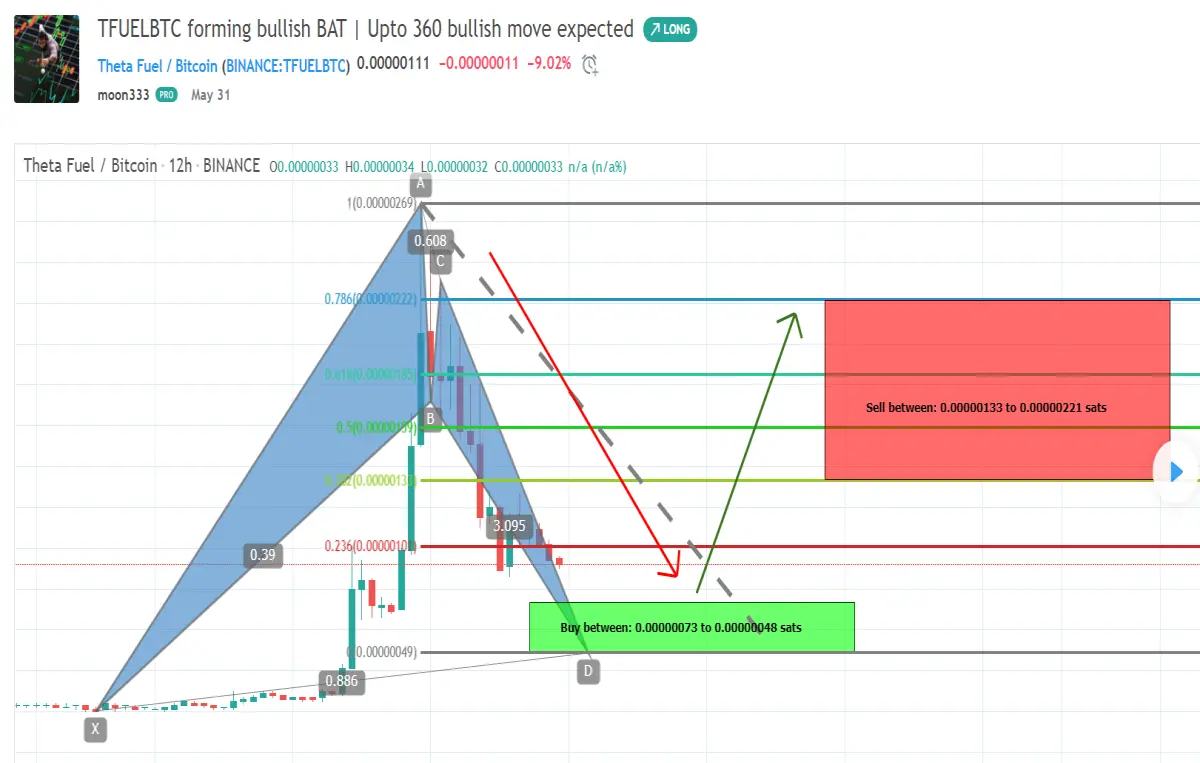
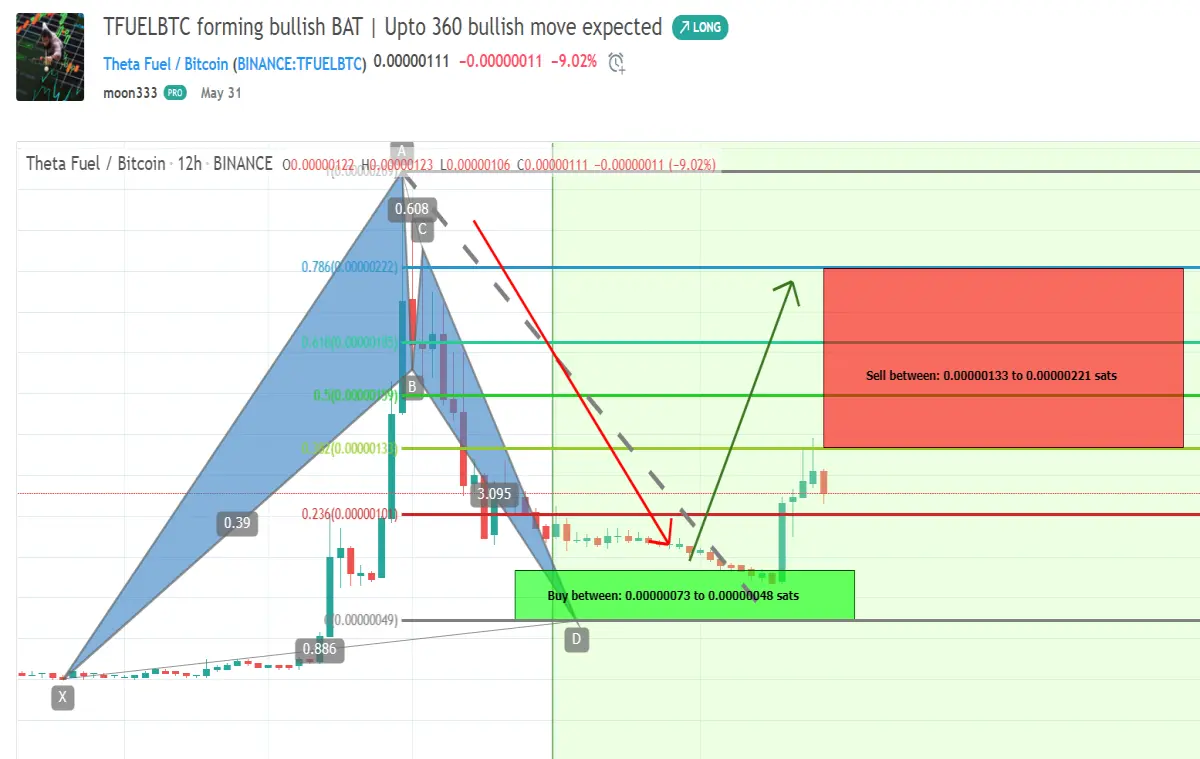
On 12 hour chart the Tfuel token was forming a bullish harmonic BAT pattern and finally after entering in potential reversal zone it took a powerful bullish divergence and reached up to 0. 00000138 sats and produced more than 105% so far. The buying and sell targets were as below:
Buy between: 0.00000073 to 0.00000048 sats
Sell between: 0.00000133 to 0.00000221 sats
Tfuel with BTC pair bullish BAT before execution:
Tfuel with BTC pair bullish BAT after execution:
Click here to visit this old article on tradingview
Now what next???
Now some people would have sold Tfuel at the sell zone that was defined as per Fibonacci sequence of bullish BAT pattern. But there would be some other people would like to take a complete ride of this rally. Definitely everyone would have there on set of strategies for this purpose but here I would suggest to use the the Bill William Alligator indicator that is very significant and important indicator to catch the bullish and bearish rallies. It is also called bill Williams 3 lines. It is available free of cost on tradingview. By the way if you don't have account on tradingview then I am sharing my referral link as below you can just click on the link and you can go for the free or paid account:
https://www.tradingview.com/gopro/?share_your_love=moon333
Bill William three lines or Bill william alligator and other simple moving averages:
Now let’s move back to the topic. While using bill Williams 3 lines or Bill William alligator indicator I always suggest to use the combination of the some other indicators as well because sometime it can give the false signals because the bill William indicator is constitute of three small time period moving averages first one is 5 that is called lips second one is 8 that is called teeth and third one is 13 that is called jaw. And there is possibility that such small time period moving averages can produce false signals therefore in order to avoid the false signals we need the help of some other indicators. For example I normally use the combination of four simple moving averages to avoid the false signals of William 3 lines and these simple moving averages are with the time period of 25 50 100 and 200.
In Bill William three lines indicator whenever the smallest time period moving average moves above all other simple moving averages and teeth comes in the centre and jaw the biggest time period moving average moves below all other moving averages then it is called that the alligator mouth his opened. And it is the bullish signal. And whenever the smallest time period moving average moves below other moving averages and teeth comes in centre and jaw the biggest time period moving average moves above all moving averages then it is called that the alligator mouth is closed that is the bearish signal.Therefore whenever the alligator’s mouth is opened then we should not sell and if the alligator’s mouth is closed then we can sell because it is a bearish signal.
At this time the alligator’s mouth is opened and Bill William 3 lines are below the price action of the Tfuel. But in order to avoid the false signal if the price action moves down the Bill Williams 3 lines and alligator mouth gets closed. Then we should wait and see whether we have any support of the simple moving averages with the time period of 25, 50, 100, or 200. If we have any immediate support of any of these MAs then we should wait for the price action to cross down that simple moving average if that is also broken down then we can sell or otherwise we should wait for this simple moving average to be broken down. This way can save us from the false signals of Bill William three lines. Because most of the times the price action moves down from these simple moving averages and aglligator’s mouth gets closed and in a very short period of time the signals get reversed and traders get trapped in bull or bear traps.
Bill William 3 lines or Bill William alligator indicator:
Simple moving averages 25, 50, 100 and 200:
Conclusion:
The BAT pattern Tfuel has been executed successfully. Therefore if someone wants to sell here the he/she can sell it here however the Theta token’s BAT pattern still in process and moving towards the potential sell zone. Therefore we can wait and hold this token to reach up to sell zone before placing sell orders. But don’t forget the stop-loss strategy as I have mentioned in my previous idea. You can also visit my previous article to watch the stop loss strategy:
Note: This idea is education purpose only and not intended to be investment advice, please seek a duly licensed professional and do you own research before any investment.





