
About Dash:
Dash (DASH) is described ad digital cash that offers the financial freedom all.
The system offers fast and easy payments secure with complete security and has almost no fee.
Dash is developed for real time use cases,
Dash has a strong aim to give completely decentralized solution for payments, where user can buy different products from different merchants and it is also traded at major exchanges and brokers around the world.
The Technical Analysis Of Dash Price:
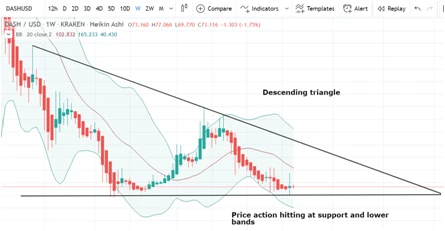
On week chart the priceline of Dash is moving within a descending triangle and at this time it is hitting the support of triangle and lower bands of bollinger bands after Dec 2018.
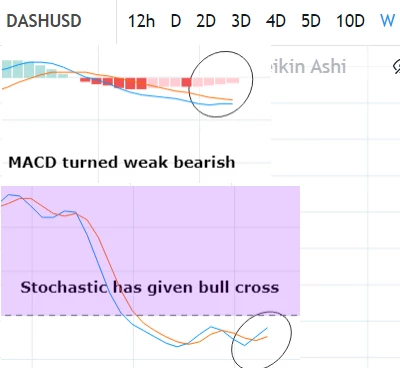
After hitting the support the Moving Average Convergence Divergence (MACD) turned weak bearish from strong bearish and Stochastic has given bull cross from the deep of oversold zone, soon the MACD will be turned strong bullish.
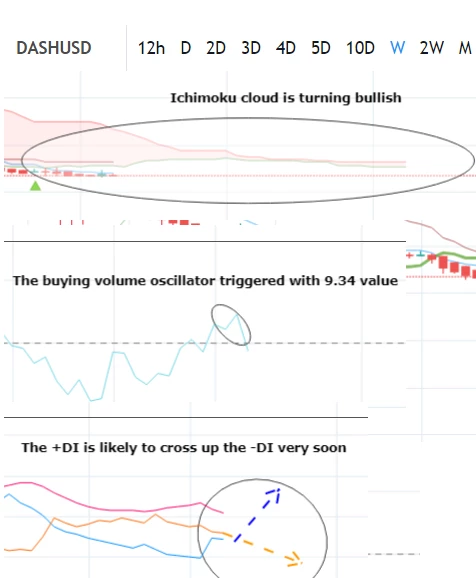
The ichimoku cloud is turned weak bearish from strong bearish and in directional movement the +Dl is likely to coross up the -Dl soon and the volume oscillator having value 9.34 is triggered with buying volume.
And after all these indications the most powerful signal is a bullish BAT pattern is formed within this triangle and the price action has been entered in the potential reversal zone of this BAT pattern and when Dash will take bullish divergence form this PRZ zone then it can lead the priceline to breakout the triangle's resistance very easily.
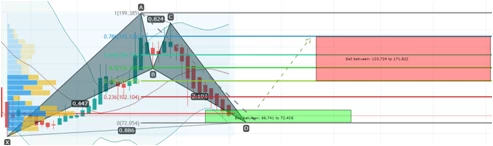
I have defined my sell targets according to this BAT pattern however the price action can move far beyond these targets, the buying zone is the 0.786 to 0.886 Fibonacci retracement of X to A leg and sell targets are defined 0.382 to 0.786 Fibonacci projection of A to D leg as below:
Buy between: 86.741 to 72.408
Sell between: 120.724 to 171.822
So this trade plan has potential to give upto 137% profit.
Regards,
Atif Akbar (moon333)






