
Introduction:
Hello friends! Welcome to the latest update on Storj Coin. In this video, we will discuss Storj’s recent price movements, focusing on a major breakout and key resistance levels that need to be overcome for a significant bullish move.
Storj's Recent Breakout from a Major Falling Wedge Pattern
Storj has recently broken out of a big falling wedge pattern, a bullish reversal indicator. As you may remember from my last video, I highlighted three major resistance levels for Storj. While Storj has already overcome the first of these resistances, two more remain that need to be breached before we can expect a significant upward trend.
On the 7-day time frame chart, we can clearly see that Storj broke out of the falling wedge pattern. However, the price is currently stuck inside a downward channel. This downtrend, combined with a wider, long-term down channel, has kept Storj from making a significant price surge.

Analyzing the Downward Channels
Currently, Storj is trading within a smaller downward channel. To start a massive bullish move, it must first break out of this smaller channel. After that, the price would need to break through the bigger, wider down channel that has been in place for a considerable amount of time. Once both these channels are broken, we could see a strong upward trend.
Despite the challenges posed by these resistance levels, Storj’s breakout from the falling wedge is a positive sign, signaling that a significant move may be in the works.
Trade Signal: Storj’s 18% Pump on September 18th, 2024
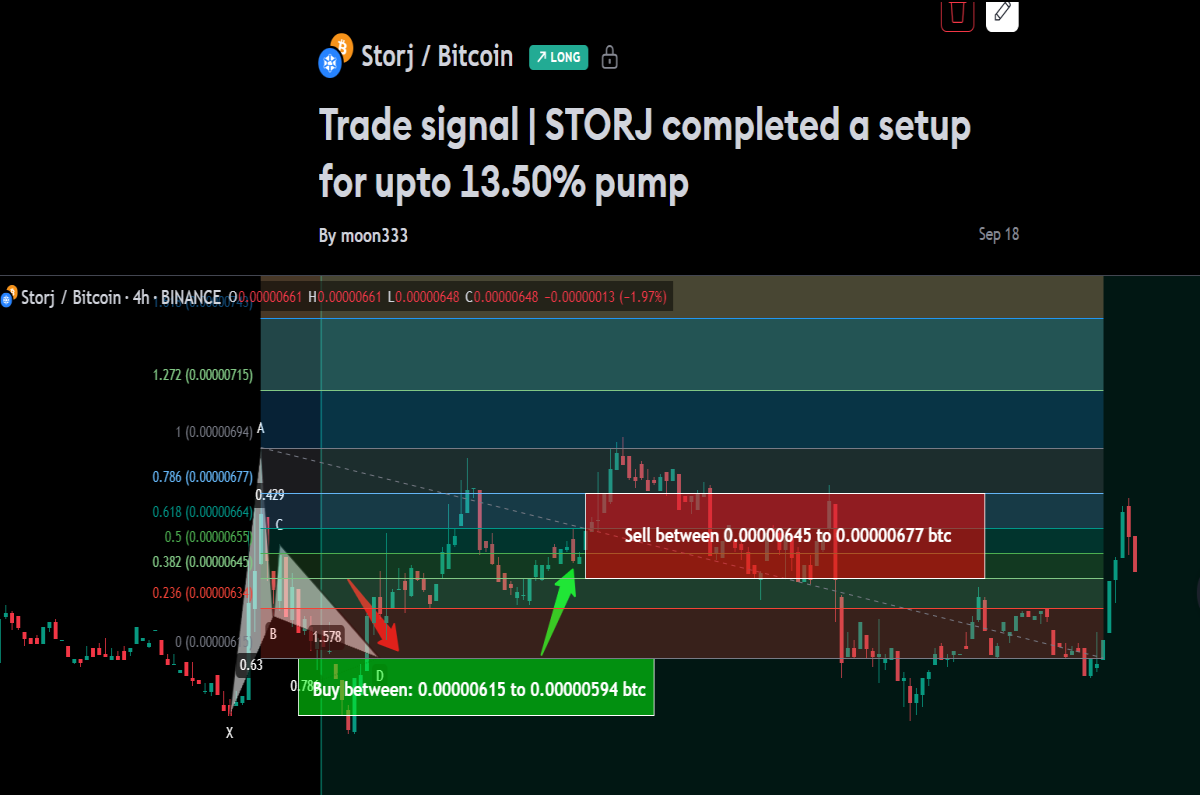
In my most recent trade signal for Storj, shared on September 18th, 2024, I highlighted a harmonic bullish Gartley pattern that formed with the Bitcoin pair on the 4-hour time frame chart. This was a complete trade setup, including a defined buying zone, sell targets, and a stop loss.
Trade signal before pump:

Trade signal after the pump:
Click here to visit this signal
Following this signal, Storj experienced a nice reversal after dropping deeper into the buying zone, which resulted in an 18% price pump. If you'd like to catch similar opportunities before they happen, consider joining me as a YouTube or Patreon member, where I share exclusive daily trading signals.
Live Chart Analysis: Storj Coin's Daily Time Frame
Now, let’s take a look at the daily time frame chart. Storj is currently moving inside a downward channel that it entered in November 2023. After experiencing a fake breakout a few days ago, the price reentered the channel but is now making another attempt to break through the channel's resistance.
If Storj successfully breaks out of this channel, it could hit the target at the top, around $1.21. However, if the price faces another rejection, it may retest the support level near 18 cents. Should the price break out of both the smaller and larger down channels, Storj could achieve a target between $4 to $5, which is also the target for the breakout from the big falling wedge pattern.
Key Resistance Levels to Watch
On the 7-day time frame chart, we can see that Storj previously faced rejection from the larger down channel after breaking out of the falling wedge pattern. The next step is for Storj to break through the resistance of the smaller down channel, which could then pave the way for an attempt to breach the bigger down channel.
Once these two key resistance levels are broken, Storj’s price could continue moving higher, aiming for the $4 to $5 range, which corresponds to the top of the larger falling wedge.
Conclusion
Storj is in a promising position, having already broken out of a major falling wedge. However, it still needs to break through two crucial resistance levels—the smaller and larger downward channels—before we can see a significant bullish trend.
If you enjoyed this analysis, please like the video and subscribe to the blog for more updates. Additionally, if you're interested in receiving daily trading signals, feel free to join me as a YouTube or Patreon member, where I provide detailed trade setups and market analysis. Links to join are as below:
Take care, and happy trading!


