
About Stellar:
The Stellar is an open source network which works in distributed environment and owned by the community.
The stellar is used to cross asset transfers of value, and aims to be an open financial system which gives the people of all levels to access at low cost.
This network handles the exchange between the fiat currency to cryptocurrency.
The Stellar organization that supports this network is centralized like Ripple financial services.
Technical analysis of Stellar's price:
The XLM at the moment is ranked at 10th out of more than 2300 cryptocurrencies in the world.
It can be the second cryptocurrency after Bitcoin which can take a very very big bullish move this year after BTC among the top 10 digital assets.
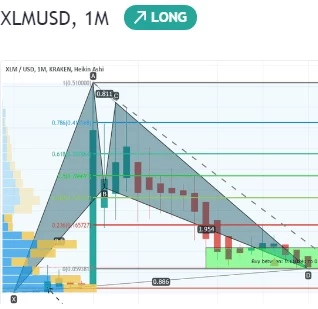
On month chart the price action of XLM with US Dollar pair has formed a very big bullish BAT pattern with all required retracments, after initial leg the next A to B leg is retraced between 0.382 to 0.50 Fibonacci and B to C leg is moved between 0.382 to 0.886 Fibonacci levels and now the final C to D leg is retraced between 0.786 to 0.886 Fibonacci sequence and entered in potential reversal zone.
This pattern starts from Feb 2017 Up til now.
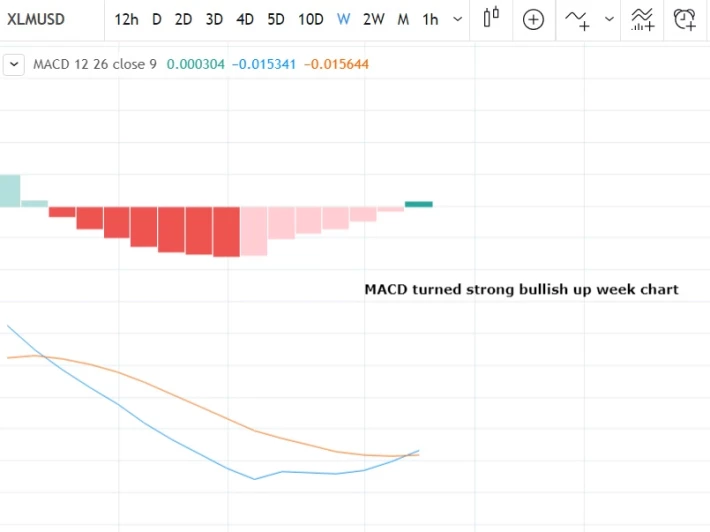
MACD turned strong bullish up week chart.
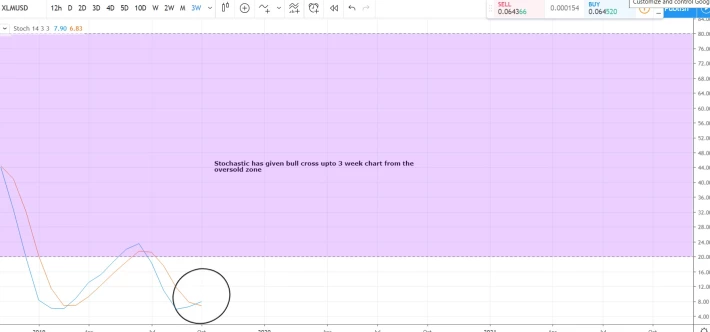
Stochastic has given bull cross upto 3 week chart from the oversold zone soon it will be reflected upto month chart.
After applying Fibonacci calculation method on pattern the buying and sell targets are as below:
Buy between: $0.110241 to $0.059381
Sell between: $0.231517 to $0.413568
The extreme sell target: $0.413568 is the 0.786 fibonacci projection of C to D leg but if the price action will cross up this target then the XLM can make higher than the previous high of Feb 2018.
Regards,
Atif Akbar (moon333)
Disclaimer: The information contained in this article is for education purpose only this is not intended to be investment advice. Please seek a duly licensed professional for investment advice.






